
Executive cloud reporting is a decision-ready summary of cloud risk, cost, and compliance status, built for leaders who need to act, not audit line items. The right format is a one-page summary with drill-downs behind it, refreshed on a monthly cadence with weekly or real-time alerts for anomalies. The Cloud Security Alliance recommends limiting takeaways to three per report. Some platforms exist precisely to keep that summary accurate without adding headcount.
TL;DR:
- Coverage rate must always be displayed alongside risk and compliance KPIs, as low monitoring coverage undermines report accuracy.
- Executive reports should focus on three key takeaways, each paired with a clear narrative on recent changes and decisions required.
- Automated AI narratives and anomaly detection improve speed and predictive insights but require source traceability and human review for trust.
- Rollout should start with a few trusted KPIs, then gradually automate and expand, with ongoing iteration based on decision impact and action closure.
- Choosing a reporting tool depends on integration capability, role-based access, multi-cloud support, and audit lineage, especially in complex multi-cloud environments.
Table of Contents
- What KPIs Belong in Executive Cloud Reports?
- How Should Executive Cloud Reports Be Formatted and Delivered?
- What Should Executives Look for in Cloud Reporting Tools?
- How Is AI Changing Executive Cloud Reporting?
- How Do You Roll Out Executive Cloud Reporting?
- How Everythingcloud Fits the Executive Cloud Reporting Checklist
- Why Integration With Existing Systems Is the Hardest Part
- Securing Executive Cloud Reports Without Slowing Leaders Down
- Author Perspective: Leading Adoption Without the False Starts
- Get Executive-Ready Cloud Reporting Running This Quarter
- Sources
- FAQ
What KPIs Belong in Executive Cloud Reports?
Most cloud dashboards drown executives in charts nobody asked for. The fix is a short list of KPIs that map directly to a business decision, not a technical one.
Security vendors recommend anchoring executive dashboards around six recurring metrics that translate raw telemetry into something a board member can act on, according to Orca Security’s guidance on executive cloud risk dashboards. Here’s the practical set, with the decision each one should trigger:
- Overall risk score — a single composite number; a sustained upward trend should trigger a security budget conversation, not a shrug.
- Compliance posture percentage — the share of controls passing audit; a drop below a set threshold should trigger immediate remediation, not next quarter’s plan.
- Mean time to remediate (MTTR) — how fast findings get closed; a rising MTTR signals understaffing or tooling gaps that deserve investment.
- Cloud asset coverage rate — the percentage of infrastructure actually monitored; low coverage means every other KPI on this list is unreliable.
- Cost trend and savings waterfall — spend against budget and where savings actions landed; a widening gap should trigger a FinOps review.
- Service availability and business impact — uptime tied to revenue-generating systems, not abstract SLAs.
Each KPI is only as trustworthy as the data feeding it. Coverage gaps quietly undermine every other number on the page. That’s why coverage rate deserves its own line, not a footnote.
Pro Tip: If your monthly report doesn’t show a coverage percentage next to your risk score, ask why. A risk score without coverage context is a guess wearing a suit.
Cost and savings metrics work the same way. A cloud unit economics approach ties spend to output, so a rising cloud bill next to flat revenue reads as a red flag instead of a rounding error.
How Should Executive Cloud Reports Be Formatted and Delivered?
The format matters more than the platform generating it. A report an executive actually reads follows a specific pattern, not a dump of every metric IT tracks.
The Cloud Security Alliance’s guidance is blunt on this point: keep the summary to one page, cap takeaways at three, and pair every metric with a short narrative explaining what changed and what decision it requires. Executives don’t need a chart of the last ninety days of CPU utilization. They need to know why the number moved and what you want them to approve.
Cadence should scale with urgency, not calendar convenience:
- Daily anomaly alerts for cost spikes, security events, or availability drops that can’t wait for a scheduled report.
- Weekly operational briefs for the teams managing the response, not the board.
- Monthly executive snapshots covering the core KPIs, trend direction, and the three takeaways that matter this cycle.
- Quarterly deep dives that revisit strategy, budget allocation, and whether the KPI set itself still fits the business.
Near-real-time refresh beats static weekly exports for anything security-related, since a risk score that’s a week stale is a risk score you’re negotiating with, not managing, per Orca Security’s findings on refresh cadence.
The loop closes with follow-through. The Cloud Security Alliance recommends assigning owners and deadlines to every flagged action, then reporting back on closure at the next cycle, whether that’s monthly or quarterly. Without that step, the report becomes theater. Reports also need to export cleanly. Rapid7’s InsightVM documentation describes scheduled generation, filtered views, and admin controls for rerunning historical reports, a pattern worth demanding from any tool you evaluate: if a board member asks for last quarter’s numbers, someone shouldn’t have to rebuild the report from scratch.
What Should Executives Look for in Cloud Reporting Tools?
Skip the vendor demos for a minute and think in categories instead. Most executive cloud reporting solutions fall into one of five buckets, and each one solves a different piece of the puzzle:
- Governed BI and warehouse-native analytics — general-purpose platforms with certified metric layers, strong for cross-department reporting but often need heavy configuration for cloud-specific KPIs.
- Executive reporting layers — purpose-built summary tools that sit on top of existing data sources and translate raw metrics into board-ready views.
- FinOps and cost platforms — focused on spend visibility, commitment management, and savings tracking, usually with less depth on security posture.
- Security and compliance executive dashboards — strong on risk score and compliance percentage but frequently weak on cost context.
- Managed platform-plus-service models — a combination of software and a FinOps or security team that interprets the numbers and drives action, useful when internal staff is stretched thin.
The integration layer determines whether any of these categories actually work in practice. A semantic layer with certified metric definitions prevents the classic problem where finance, engineering, and security all show up to the same meeting with three different numbers for “cloud spend.” Quaeris’s research on executive analytics points to this as one of the more common failure modes in enterprise reporting: not bad data, but inconsistent definitions of the same metric across teams.
Role-based access matters just as much. A board member needs the one-page summary; a cloud engineer needs the drill-down behind it. The same platform should serve both without exposing raw billing data to people who shouldn’t see it. Audit trail and data lineage close the loop, showing exactly which source system, transformation, and timestamp produced each number on the executive page.
Before approving a reporting tool, run it through a short checklist:
- Does it map to a certified, single source of truth for each KPI, or will teams still argue about whose number is right?
- Can it export board-ready formats without manual rebuilding?
- Does it show data lineage back to the source system for audit purposes?
- Can access be scoped by role without duplicating the underlying data pipeline?
- Does it support the multi-cloud footprint you actually run, not just the one the vendor demoed?
Enterprises running workloads across multiple cloud service providers should weight that last question heavily. A tool built for a single cloud rarely scales cleanly to three.
How Is AI Changing Executive Cloud Reporting?
AI-generated dashboards can meaningfully cut the time it takes to compile an executive report, according to PedowitzGroup’s research on automated compliance reporting, which points to faster status delivery and earlier predictive risk insight as the main gains. That’s a real shift from the old model of an analyst spending two days pulling numbers into a slide deck.
Here’s what AI can practically do in this context:
- Auto-generated narratives that turn a metric change into a plain-English explanation of what happened and why.
- Anomaly detection that flags a cost spike or unusual access pattern before it shows up in next month’s report.
- Predictive risk alerts that surface a compliance drift trend before it becomes an audit finding.
- Scheduled, role-based delivery so the board gets the summary and the ops team gets the detail, automatically.
None of that works without guardrails, though. Automation shortens production time, but every automated narrative needs a clear path back to its source data, or nobody can verify what the AI actually claims happened, a tension the PedowitzGroup research flags directly. Demand three things during procurement: source traceability on every generated statement, a confidence indicator when the model is inferring rather than reporting, and a human review step before anything goes to the board unedited.
The productivity case for this kind of automation is broader than cloud reporting alone. Partner research on AI adoption in agency and enterprise settings found meaningful ROI when AI handled repetitive compilation work, freeing skilled staff for judgment calls instead. Validate any AI reporting tool the same way: run it in parallel with your existing manual process for one full cycle, compare the narratives line by line, and only cut over once the gaps close.
How Do You Roll Out Executive Cloud Reporting?
Rolling out executive cloud reporting works best as a phased build, not a single big-bang launch. Trying to stand up every KPI, integration, and automation rule in month one is how these programs stall.
- Weeks 1 to 4: quick wins. Pick two or three KPIs you already trust the data for and ship a one-page summary manually if you have to. Prove the format works before automating it.
- Months 1 to 2: governance and metric definitions. Lock down certified definitions for each KPI, assign a data owner per metric, and document lineage back to source systems. This is where the cloud governance framework work pays off.
- Months 2 to 3: automation and delivery. Layer in scheduled delivery, anomaly alerts, and narrative automation once the underlying metrics are stable and trusted.
- Ongoing: measurement and iteration. Revisit the KPI set quarterly. Retire metrics nobody acts on and add ones tied to new business priorities.
Assign roles early. An executive sponsor keeps the program funded and prioritized. A data owner is accountable per KPI. Cloud operations and FinOps teams supply and validate the underlying numbers, and compliance signs off on framework mapping before anything reaches the board.
Track three success metrics as the program matures: adoption (are executives actually opening the report, or is it going straight to an unread folder), time saved on board prep, and closure rate on assigned actions. That last one is the real test. A dashboard nobody follows up on isn’t a reporting program; it’s decoration. Improving cloud cost visibility toward a high allocation rate is a reasonable early target for the FinOps side of this rollout.
How Everythingcloud Fits the Executive Cloud Reporting Checklist
Everythingcloud was built around the exact gap this article keeps circling back to: leaders getting recommendations instead of results. The platform provides real-time visibility into AWS, Azure, Google Cloud, Microsoft 365, and AI spending, which covers the multi-cloud coverage KPI directly instead of forcing a manual rollup across separate vendor consoles.
Governance is built to CIS and NIST alignment, addressing the compliance posture and audit trail requirements this article’s KPI section flags as non-negotiable for board-ready reporting. That matters for the lineage question executives should be asking in any vendor RFI: where did this number come from, and can it survive an audit.
On the automation side, Everythingcloud identifies optimization opportunities and automates cost-saving actions rather than stopping at a recommendation an engineer has to act on manually. For MSPs and technology partners, the platform is offered as a turnkey model, allowing partners to launch managed FinOps, cloud optimization, and AI optimization services without building the reporting and governance layer from scratch. Savings outcomes are verified against invoice-level billing, which is the kind of provenance check this article’s AI guardrails section insists on.
For enterprises managing multi-cloud environments, the practical question isn’t whether to build this reporting layer internally or buy it. It’s how fast the current manual process is costing decision speed while a governed alternative already exists.
Why Integration With Existing Systems Is the Hardest Part
Most executive cloud reporting projects don’t fail on the dashboard. They fail on the plumbing underneath it. Every enterprise running AWS, Azure, and Google Cloud simultaneously already has three different billing formats, three different tagging conventions, and at least one legacy on-prem system nobody wants to touch.
The first real challenge is inconsistent tagging and cost allocation across cloud accounts. If engineering tags resources one way and a newly acquired business unit tags them another, your cost trend KPI is comparing apples to a completely different orchard. Fixing this requires a governance pass before any reporting tool gets deployed, not after.
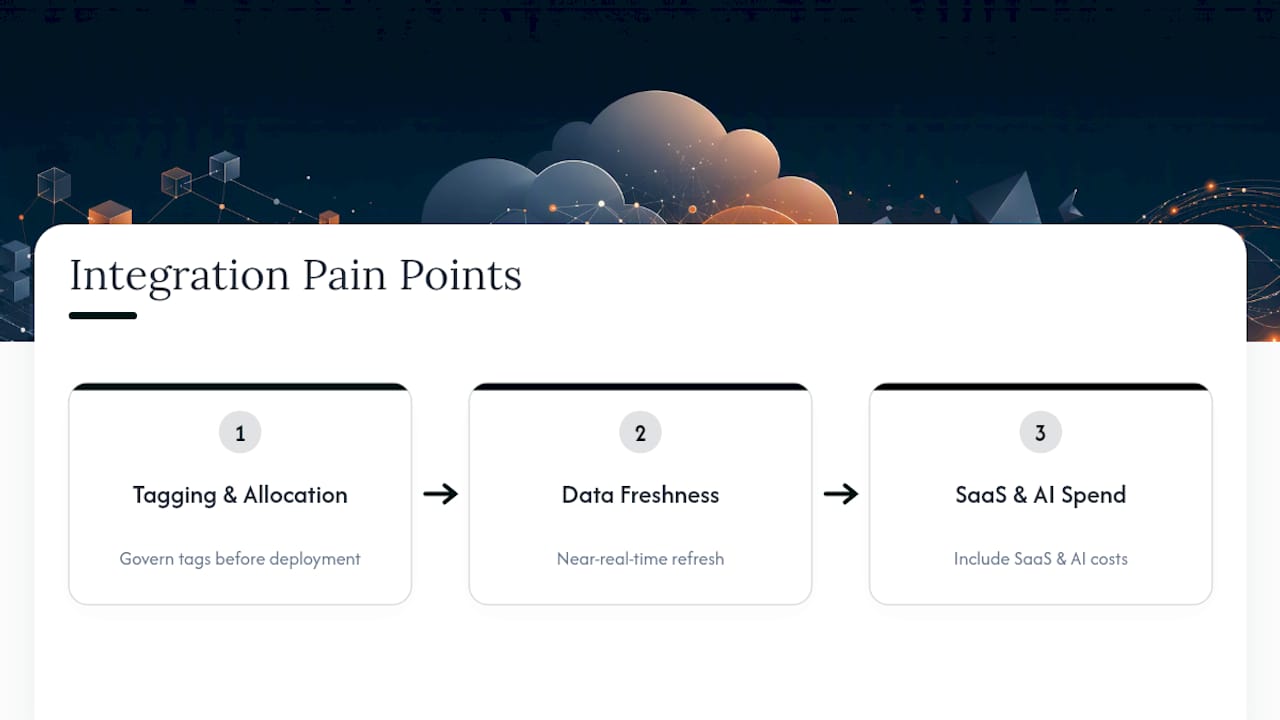
The second challenge is data freshness mismatches. Billing APIs from different providers update on different schedules, so a report pulling from all three at once can show numbers that are accurate individually but misleading together. A near-real-time refresh model, rather than nightly batch jobs, reduces this friction considerably.
The third challenge is SaaS sprawl outside the core cloud providers. Executive reports that only cover infrastructure spend miss a growing share of enterprise technology cost sitting in SaaS subscriptions and AI token consumption, both of which increasingly need the same governance treatment as core cloud infrastructure.
Securing Executive Cloud Reports Without Slowing Leaders Down
An executive cloud report carries some of the most sensitive information in the company: security risk scores, compliance gaps, and exact spending figures by business unit. That combination makes access control a design requirement, not an afterthought bolted on later.
Role-based access is the starting point. A board member sees the one-page summary and the three takeaways. A regional VP might see drill-downs for their business unit only. An engineer sees the technical detail behind a specific finding but not necessarily company-wide financial figures. Building that separation into the platform, rather than managing it through spreadsheet permissions, closes the most common leak point in enterprise reporting.

Data privacy extends to how long historical reports stay accessible and who can export them. A report that leaked externally with exact risk scores and compliance gaps attached is a gift to anyone probing for weaknesses, so export controls and audit logging on every download matter as much as the initial access grant. Encryption in transit and at rest for report data should be table stakes, and any AI-generated narrative layer needs the same access restrictions as the underlying data it summarizes. A narrative that surfaces a compliance gap shouldn’t be viewable by someone who couldn’t see the underlying finding.
Author Perspective: Leading Adoption Without the False Starts
Most executive cloud reporting programs don’t fail on technology. They fail because nobody senior actually champions them past the first quarter. Sponsorship has to be active, not a name on a kickoff slide.
Start small. One KPI set, one format, one cadence, proven before you automate anything. Insist on a single shared view across security, finance, and operations, since three departments with three different numbers for the same metric will quietly kill trust in the whole program. Then measure the thing that actually matters: did decisions get faster, and did assigned actions actually close.
— Dan
Get Executive-Ready Cloud Reporting Running This Quarter
If you’re an enterprise with an internal FinOps or cloud team that just needs the visibility layer and governance rails, The Platform gives you real-time reporting across AWS, Azure, Google Cloud, and AI spend without building the semantic layer and metric definitions from scratch. If you’d rather hand the ongoing optimization and reporting work to a team that does it full time, Managed FinOps covers continuous monitoring, automated cost-saving actions, and the executive-ready summaries this article has walked through, verified against invoice-level billing rather than estimates.
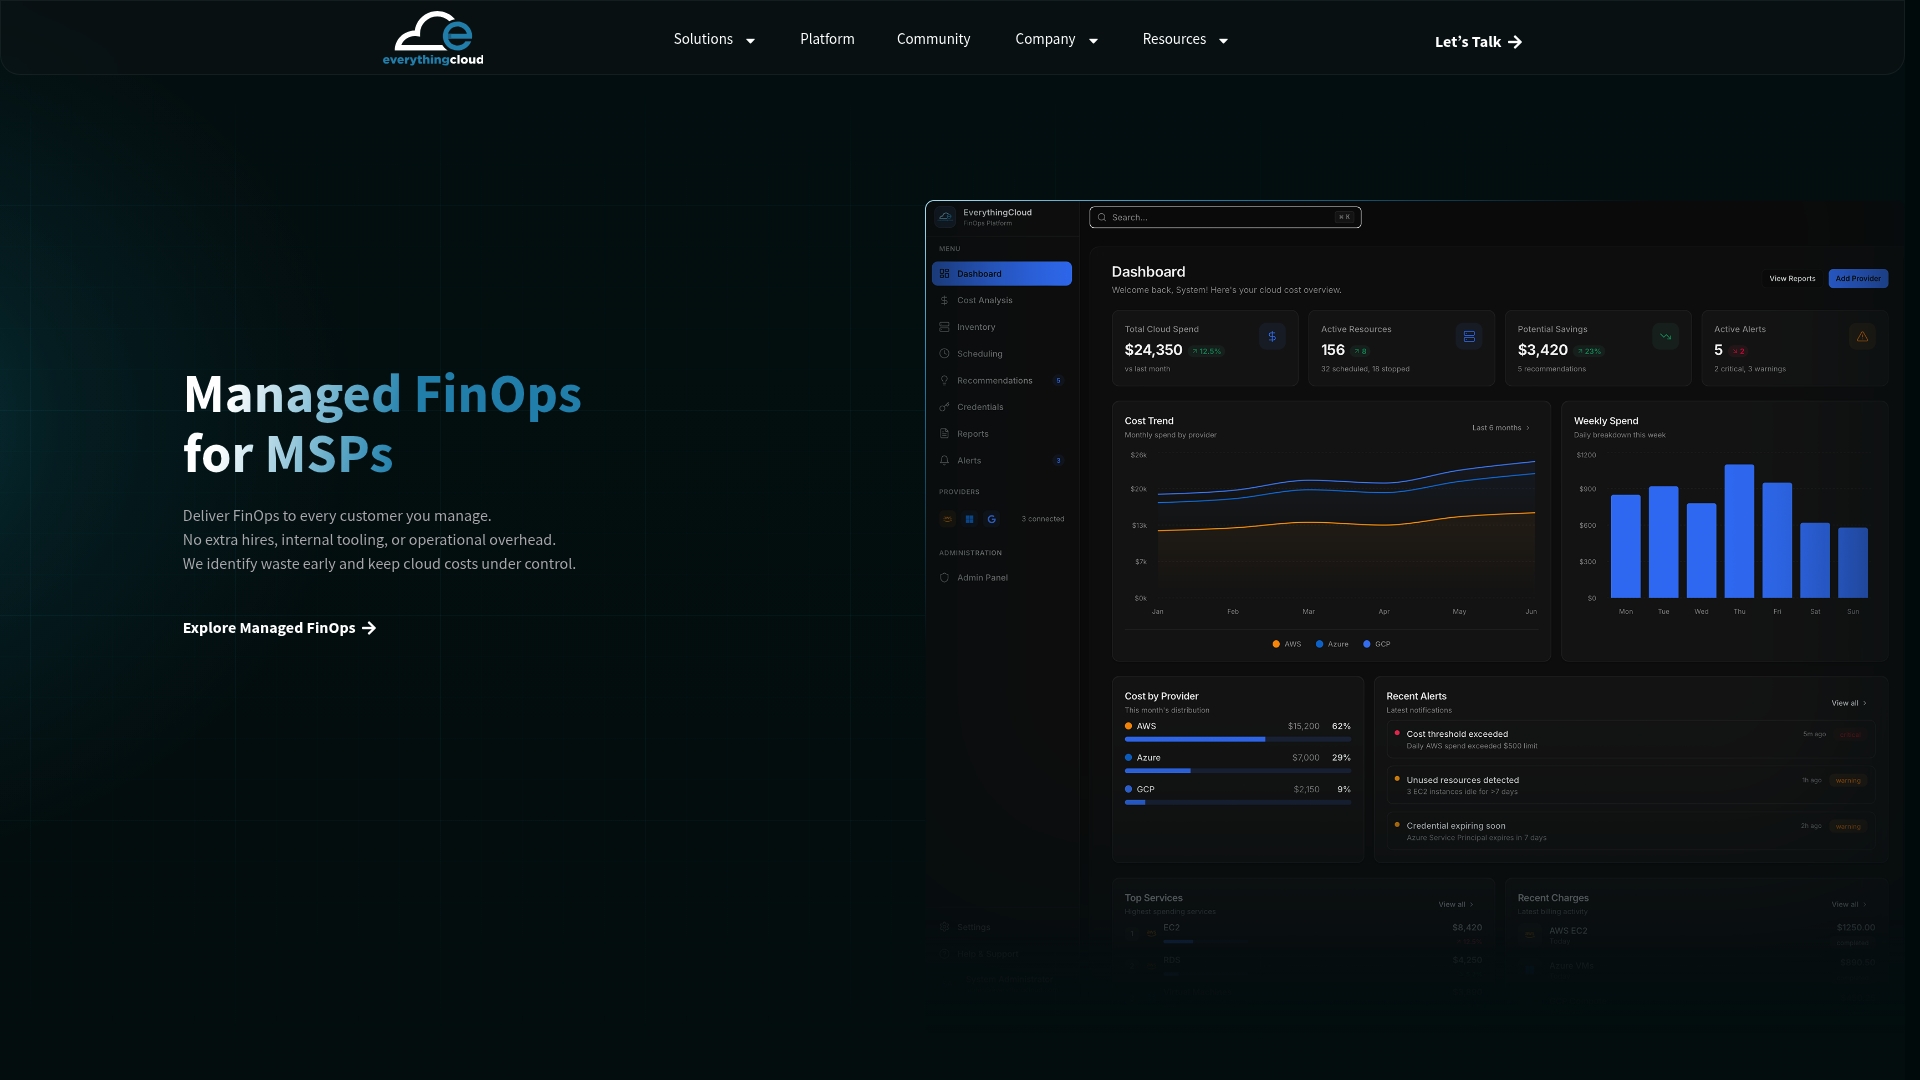
MSPs and technology partners looking to offer this as a service to their own customers, instead of building a reporting stack in-house, should look at the Founding Partner Membership at $500 per month, a turnkey path to launching managed FinOps and executive reporting as a recurring revenue line. Enterprises weighing a broader, ongoing optimization program across cloud, SaaS, and AI spend can also look at Continuous Cloud Optimization for the combined platform-and-service model. Book a walkthrough and see what your current cloud spend looks like once it’s mapped to the KPIs your board actually wants to see.
Sources
- 5 best practices for executive reporting | Cloud Security Alliance
- Automated Compliance Reporting for Executive Leadership | PedowitzGroup
- Cloud reporting — Rapid7 InsightVM documentation
FAQ
What Is Executive Reporting?
Executive reporting is a summarized view of business performance, risk, or operational status designed for leaders who need to make decisions, not review raw data. In cloud contexts, that means translating technical telemetry into KPIs like risk score, compliance posture, and cost trend, delivered as a one-page summary with supporting drill-downs, per Cloud Security Alliance guidance.
What Are the Best Cloud Reporting Tools?
There’s no single best tool; the right choice depends on whether you need governed BI, a FinOps cost platform, a security-focused dashboard, or a managed platform-plus-service model. Look for certified metric definitions, role-based access, audit lineage, and export support rather than picking based on brand alone. A platform like Everythingcloud combines multi-cloud visibility with automated optimization for buyers who want both reporting and action in one place.
What Is a Cloud Report?
A cloud report is a structured summary of cloud infrastructure performance, cost, security posture, or compliance status over a defined period. At the executive level, it strips out technical noise and focuses on a handful of business-legible KPIs with exportable formats for audits, as described in Rapid7’s cloud reporting documentation.
What Are the Four Types of Reports?
In an executive cloud context, the four common report types are real-time anomaly alerts, weekly operational briefs, monthly executive snapshots, and quarterly strategic deep dives. Each serves a different audience and urgency level, from immediate incident response to long-term budget and strategy review.
How Much Does Managed FinOps Cost With Everythingcloud?
Pricing for Managed FinOps and Continuous Cloud Optimization is available on request directly from Everythingcloud. MSPs interested in the turnkey Founding Partner Membership can see the current rate of $500 per month on the program page.