AWS Cost Anomaly Detection (CAD) uses machine learning to flag unexpected spend the moment it deviates from your account’s normal pattern, then ranks the likely causes by dollar impact so you’re not guessing where the money went. You configure it inside AWS Billing and Cost Management or Cost Explorer, and once monitors and alerts are set, it works quietly in the background. The real payoff isn’t the alert. It’s the ranked root cause that turns a scary invoice into a five-minute investigation.
TL;DR:
- Models adjust for weekly and monthly seasonality, preventing false alarms during traffic spikes or typical growth periods.
- Setting thresholds that combine dollar and percentage impacts helps distinguish between minor noise and significant cost leaks.
- Root cause rankings identify the most impactful factors across services, regions, and accounts, guiding targeted investigations.
- Integration with AWS CloudTrail and organization-wide delivery enhances accuracy in correlating usage spikes to specific actors.
- Automated workflows via EventBridge enable immediate response, but effective management depends on rigorous triage and threshold tuning.
Table of Contents
- How AWS Cost Anomaly Detection Works
- Setting Up Your First Cost Monitor and Alert Subscription
- Reading Root Cause: What CAD Tells You and What It Doesn’t
- Turning Anomalies Into Automated Workflows
- Building a Triage Process That Doesn’t Drown Your Team
- What CAD Won’t Tell You Right Away
- Where CAD Fits Inside a Managed FinOps Practice
- Get Ranked Root Causes Turned Into Action, Not Just Alerts
- Key AWS Resources Worth Bookmarking
- Sources
How AWS Cost Anomaly Detection Works
CAD builds a machine learning baseline from your historical net unblended cost, then compares daily spend against what it expected. It adjusts for weekly and monthly seasonality and organic growth, which is why a Black Friday traffic spike doesn’t trip the same alarm as a runaway EC2 fleet.
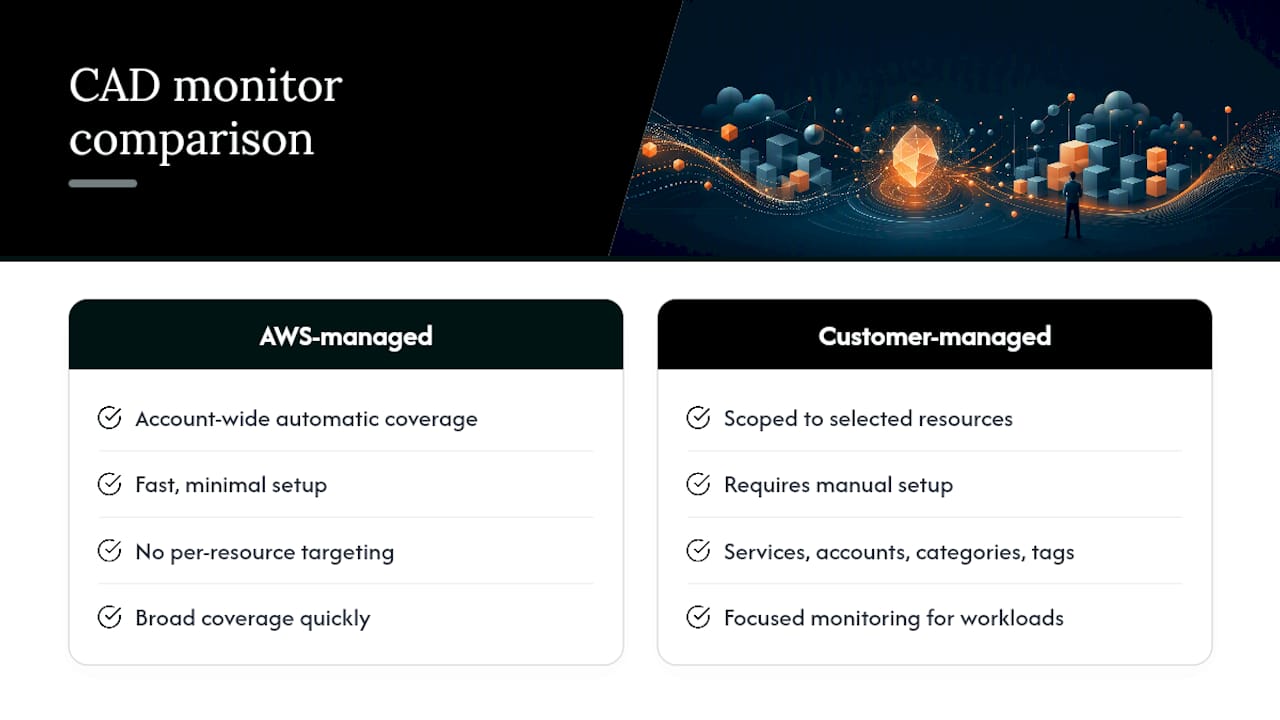
You choose between AWS-managed monitors, which watch your entire account automatically, and customer-managed monitors, which you scope to specific services, linked accounts, cost categories, or tags. AWS-managed offers broad coverage quickly. Customer-managed helps when you want focused monitoring for specific workloads.
CAD has blind spots worth knowing up front. It doesn’t reliably cover AWS Marketplace charges, and billing transfer or consolidated views can obscure the account-level detail root cause analysis depends on. If your organization spans multiple clouds, that gap matters more than it looks. Cost signals that live outside AWS entirely won’t show up here at all, which is a common blind spot in multi-cloud billing.
Setting Up Your First Cost Monitor and Alert Subscription
Getting CAD running takes minutes. Getting it running well takes a little more thought about scope and thresholds. Here’s the sequence:
- Create a cost monitor. In Billing and Cost Management, choose AWS Services for full-account coverage, or pick a dimension like linked account, cost category, or tag if you need narrower visibility.
- Let it build a baseline. Detection doesn’t happen instantly. AWS Cost Anomaly Detection typically starts detecting within 24 hours of monitor creation, though a brand-new service needs roughly ten days of history before it can be evaluated reliably.
- Create an alert subscription. Attach it to the monitor and choose a notification channel: email or Amazon SNS.
- Pick your frequency. Immediate alerts suit high-value accounts where minutes matter. Daily or weekly digest summaries suit lower-priority monitors where you’d rather review a batch than get paged constantly.
- Set a starting threshold. Combine a dollar floor with a percentage change so a $50 anomaly on a $100 service doesn’t drown out a $5,000 anomaly on a $2 million service.
Name monitors by scope, not by date. “Prod-EC2-LinkedAccount-4471” tells you more six months from now than “Monitor-March.” Start thresholds loose, then tighten once you see what normal noise looks like for that account.
Reading Root Cause: What CAD Tells You and What It Doesn’t
Once an anomaly fires, CAD doesn’t just say spend went up. It ranks contributing factors by dollar impact across service, linked account, Region, and usage type, and can surface up to ten root causes for a single anomaly above your alerting threshold.
A few things to keep in mind when you’re reading that breakdown:
- Estimated attributions are directional, not invoice-precise. If the listed root causes don’t sum exactly to the total anomaly, treat them as investigative pointers and confirm exact costs in Cost Explorer.
- Every anomaly detail page links straight into Cost Explorer, letting you slice by tag, account, or time window without rebuilding the filter from scratch.
- AI-powered investigations, available through Amazon Q or the FinOps Agent, turn that ranked list into a plain-language explanation of why the anomaly happened, not just what changed.
- Those AI investigations get meaningfully deeper when organization-wide CloudTrail delivery to CloudWatch Logs is enabled, since it lets the system correlate usage-driven causes against actual API activity rather than billing data alone.
The distinction between usage-driven and rate-driven anomalies matters here. A usage spike (someone left a fleet of instances running over a weekend) needs CloudTrail correlation to find the actor. A rate change (a Reserved Instance expired and you rolled onto on-demand pricing) shows up cleanly in billing events without needing that context at all.
Turning Anomalies Into Automated Workflows
Detection is only useful if it reaches the right team fast. CAD publishes an “Anomaly Detected” event to Amazon EventBridge with fields including monitorArn, anomalyId, impact, rootCauses, and anomalyDetailsLink. You can filter on any of those fields to route the event exactly where it needs to go instead of blasting every anomaly to every channel.
| Filter type | Example condition | Typical routing |
|---|---|---|
| Impact threshold | impact.totalImpact > dollar threshold |
Page on-call engineer immediately |
| Service | rootCauses.service = "AmazonEC2" |
Route to infrastructure team channel |
| Cost allocation tag | rootCauses.tag = "team:data-eng" |
Notify team owner via Slack |
| Region | rootCauses.region = "us-east-1" |
Escalate to regional cost owner |
For notification delivery, AWS User Notifications or Amazon SNS can push these events into Slack or Microsoft Teams without custom code. For automation, an EventBridge rule can open a ticket, trigger a Lambda function that stops or resizes the offending resource, or escalate based on dollar impact. That EventBridge layer is genuinely the highest-leverage piece of the whole system. It’s the difference between an anomaly sitting unread in a console tab and a ticket landing in the right queue within minutes.
Building a Triage Process That Doesn’t Drown Your Team
CAD is only as useful as the process wrapped around it; for broader context on Amazon’s business scale and services, see Inside the Amazon company that’s even bigger than Amazon.com – USA News Group. Left unmanaged, alert volume creeps up until people start ignoring the channel entirely. The fix is a repeatable workflow, not a bigger inbox.
- List anomalies in the Detected Anomalies tab, which defaults to showing the last 90 days and lets you sort by severity, service, account, or impact.
- Prioritize by cost impact and duration. A $200 spike that lasted six hours is noise. A $200 spike still running after three days is a leak.
- Investigate top drivers first, using either the root cause breakdown or an AI investigation for anomalies with ambiguous causes.
- Apply a decision rule. Small, well-understood issues (a forgotten dev instance) get automated remediation. Complex or cross-account root causes get a human ticket.
Threshold strategy deserves its own attention. Pure percentage thresholds flag tiny accounts constantly; pure dollar thresholds miss real problems in smaller environments. Combine both, and reserve customer-managed monitors for accounts or tags that need a different sensitivity than the rest of your organization.
Pro Tip: If payer-account anomalies don’t line up cleanly with what you see at the linked-account level, check whether CloudTrail is delivering organization-wide. Partial CloudTrail coverage is the most common reason root cause data looks incomplete during reconciliation.
What CAD Won’t Tell You Right Away
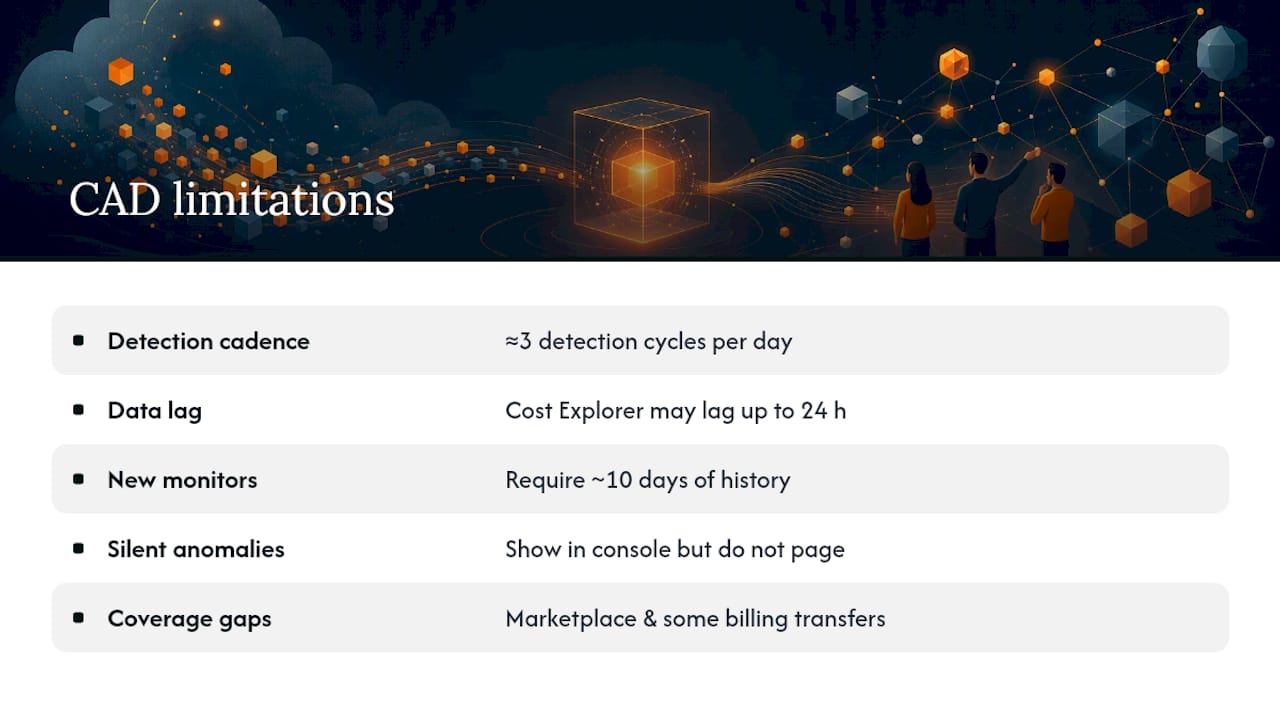
CAD runs on a cadence, not in real time. Detection cycles happen roughly three times per day, and because Cost Explorer data itself can lag by up to 24 hours, there’s a built-in delay between spend happening and an alert landing in your inbox.
New monitors and newly added services need about ten days of usage history before CAD has enough baseline to judge what’s abnormal. Anomalies that fall below your alert threshold still appear in the console. They just won’t page anyone, so it’s worth a periodic manual scan. And remember the coverage gaps: Marketplace charges and certain billing transfer configurations may sit outside what CAD evaluates at all.
Where CAD Fits Inside a Managed FinOps Practice
Most clients don’t have a CAD problem. They have a follow-through problem. Alerts fire, and nobody owns the next step. Everythingcloud ingests CAD’s EventBridge events directly into a 24/7 monitoring pipeline, so ranked root causes turn into remediation tickets or automated fixes instead of unread notifications. The gaps we see most often are the same three: tagging that’s too inconsistent to route by team, CloudTrail not delivering organization-wide, and thresholds that were never tuned after the initial setup. CAD catches the anomaly. Closing the loop is the part that actually saves money.
— Dan
Get Ranked Root Causes Turned Into Action, Not Just Alerts
CAD tells you what happened and where. Everythingcloud handles what happens after the alert fires. Our platform pulls Cost Anomaly Detection events into a continuous monitoring pipeline that watches AWS, Azure, Google Cloud, and SaaS spend around the clock, then automates the fixes that don’t need a human and routes the ones that do to the right owner with full context attached.
For MSPs, this means you can offer managed cost anomaly response without building the automation layer yourself. For mid-market and enterprise teams drowning in unrouted alerts, it means tagging gaps and threshold tuning get fixed once instead of relitigated every quarter. If you’re evaluating a managed FinOps partner to operationalize the anomalies CAD is already finding, reach out to our team and we’ll walk through what that looks like for your environment.
Key AWS Resources Worth Bookmarking
- AWS Cost Anomaly Detection user guide: the authoritative reference for monitor types and detection logic.
- Getting started with Cost Anomaly Detection: step-by-step setup and console navigation.
- AI-powered cost investigations: how Amazon Q adds plain-language root cause analysis.
- Enhanced root cause analysis blog post: details on the multi-cause API update.
Sources
- Detecting unusual spend with AWS Cost Anomaly Detection
- AWS Cost Anomaly Detection – Amazon Web Services
- Introducing AI-powered cost investigations for cost anomalies