
Cloud cost anomaly detection uses machine learning to flag spend that breaks from your expected pattern, usually within hours instead of the days or weeks a monthly invoice review would take. It looks at historical usage per service, account, or SKU, builds a forecast, and raises an alert when actual cost diverges from that forecast by enough to matter. For FinOps teams, the payoff is speed: a rogue Kubernetes cluster or an AI inference job that spikes overnight gets caught while it’s still a $400 problem, not a $40,000 one.
TL;DR:
- Anomaly detection responds within hours or minutes, identifying unexpected spend patterns that could amount to thousands or more, especially in AI workloads.
- It builds seasonal and trend-aware forecasts per service, account, or SKU and suppresses false alarms through thresholds, noise filters, and history checks.
- Proper setup involves detailed tagging, scoped monitoring, and initial observation periods of at least a month to create reliable baselines.
- Alert prioritization by dollar impact and business criticality reduces noise and prevents alert fatigue, ensuring issues are addressed effectively.
- Automated, governed workflows with clear ownership, SLAs, and logging turn anomaly detection into a proactive FinOps capability that supports compliance and continuous improvement.
Table of Contents
- What Is Cloud Cost Anomaly Detection, and How Is It Different From a Budget Alert?
- How Does Anomaly Detection Actually Work Under the Hood?
- How Do You Set Up Anomaly Detection Across AWS, Google Cloud, and Azure?
- How Do You Tune Alerts So You Get Signal, Not Noise?
- How Do You Investigate a Cost Anomaly Once It’s Flagged?
- What Does an Operational Playbook for Anomaly-Driven FinOps Look Like?
- How Does EverythingCloud Operationalize Continuous Anomaly Detection?
- What Security and Compliance Issues Come Up With Cost Anomalies?
- What Actually Matters Going Into 2026
- Get Continuous Anomaly Detection Without Building It Yourself
- Where to Learn More About Cost Anomaly Detection
- Sources
What Is Cloud Cost Anomaly Detection, and How Is It Different From a Budget Alert?
A budget alert fires when spend crosses a number you set in advance, like $10,000 a month on your compute account. It’s static, simple, and blind to context. Cloud cost anomaly detection works differently. It builds a forecast for what a service, region, or account should cost based on its own history, then flags spend that deviates from that forecast by a meaningful margin, whether the total is $500 or $500,000.
That distinction matters because cloud spend rarely moves in straight lines. A retail workload might legitimately triple during a flash sale. A batch job that runs monthly will look like an “anomaly” to a fixed threshold every single time it executes, even though it’s completely normal. Finops treats anomaly detection and fixed-threshold budgets as complementary controls rather than competing ones: budgets enforce hard caps you never want crossed, while anomaly detection catches the unexpected pattern a budget was never designed to see.
Three terms come up constantly in this space, and they’re worth pinning down:
- Anomaly — a cost data point that falls meaningfully outside the range a forecasting model expected, based on that resource’s own recent behavior.
- Cost impact — the dollar difference between what was forecast and what actually happened, which is usually a better prioritization signal than percentage deviation alone.
- Deviation — how far off the expected trend a data point sits, expressed as a percentage, a dollar amount, or both.
You reach for a budget when you know the ceiling and want a hard stop. You reach for anomaly detection when you don’t know what “wrong” will look like in advance. A mature detector shows a few tells: it learns from your feedback (marking false positives suppresses similar future noise), it keeps its false-positive rate low enough that people don’t start ignoring alerts, and it comes with a root-cause panel that tells you which service, project, or SKU actually drove the spike instead of just telling you spend went up.
How Does Anomaly Detection Actually Work Under the Hood?
Every detector needs the same raw material to function: billing line items broken out by service, region, account, tag, and SKU, plus a distinction between estimated costs and finalized billing. Without granular tags, an anomaly gets flagged at the account level and someone has to manually dig through dozens of services to find the culprit. Tagging discipline isn’t a nice-to-have here. It’s the difference between a five-minute investigation and a two-hour one.
From that raw data, the detector builds a per-series forecasting model, often one for each meaningful combination of service and account, that accounts for trend and seasonality. A workload that always spikes on the first of the month for batch billing reconciliation shouldn’t trigger the same alert as a workload that spikes for no discernible reason on a random Tuesday. Seasonality-aware models are what keep those two cases separate.
Raw statistical deviation alone would flood your queue with junk, so real detectors layer on noise filters:
- Minimum-dollar floors that ignore anomalies below a set cost impact, so a $12 deviation on a test account doesn’t page anyone.
- Percent-of-report suppression that filters out swings too small relative to total account spend to matter.
- Insufficient-history exclusions that refuse to flag a resource that hasn’t run long enough to establish a reliable baseline.
- Back-to-back suppression that prevents the same underlying issue from generating a fresh alert every hour it remains unresolved.
Vendor documentation on these suppression mechanics, including Vantage’s cost anomaly alert rules, consistently treats them as necessary rather than optional. Skip them and your team learns to ignore the anomaly feed within a month.
Pro Tip: Run your detector in observation mode for at least a month before locking in thresholds. Vendors including Google Cloud recommend this specifically because early alerts tend to overcorrect until the model has enough baseline data to trust.
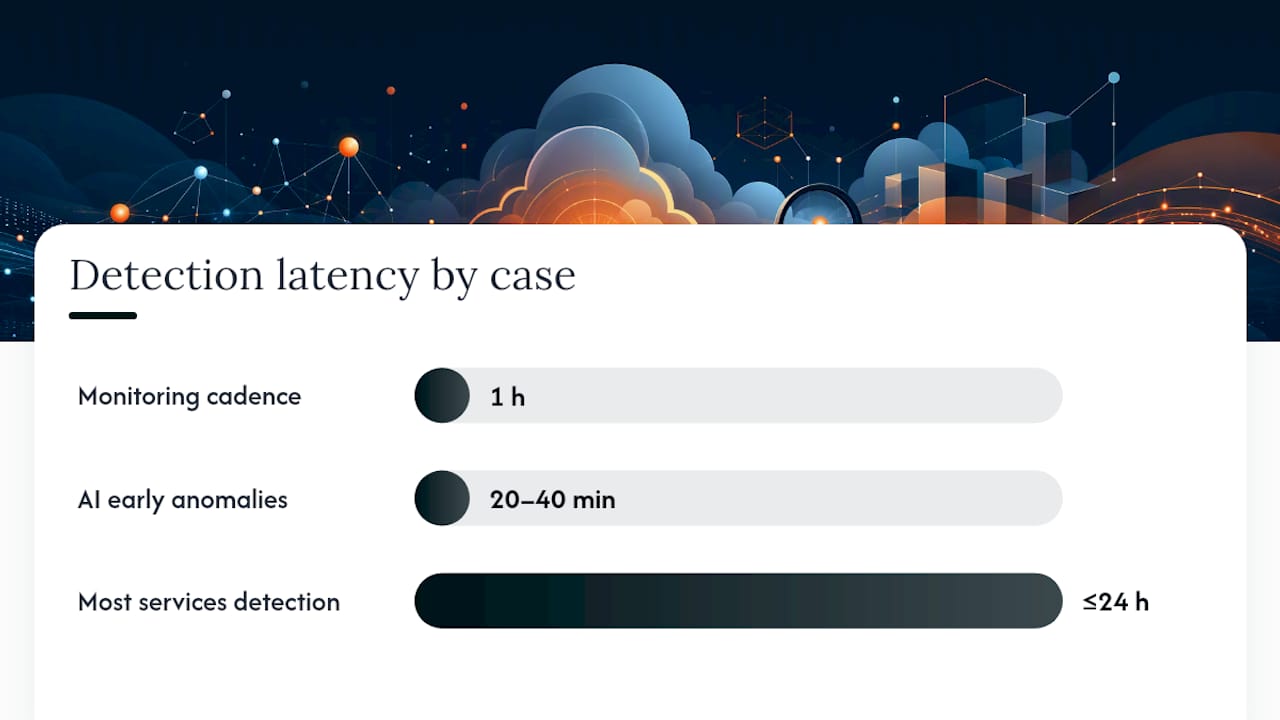
Cadence and latency vary by platform, but the direction is the same across the industry: faster, closer to real time. Google Cloud’s Cost Anomaly Detection monitors spend hourly and typically surfaces unexpected spikes within 24 hours for most services. AI workloads move even faster. Google Cloud’s billing documentation describes early anomalies for AI services that rely on near-real-time estimated costs, with alerts sometimes appearing in 20 to 40 minutes of the usage that triggered them. Those estimated figures are provisional and subject to reconciliation once finalized billing lands, so treat them as an early warning system, not a final invoice.
How Do You Set Up Anomaly Detection Across AWS, Google Cloud, and Azure?
Every major platform ships some form of native anomaly detection now, but the setup mechanics, permissions, and expected behavior differ enough that treating them identically is a mistake.
On AWS, Cost Anomaly Detection creates managed monitors that automatically adapt as your accounts, services, and tags evolve. You choose a monitor type (by AWS service, by account, by cost category, or by tag), then attach an alert subscription that routes notifications through email or Amazon SNS, which opens the door to Slack or webhook integrations downstream. New monitors need roughly 24 hours before they start reliably detecting anomalies, so don’t panic if a fresh monitor stays quiet on day one.
On Google Cloud, monitoring runs hourly by default, which supports detection within a day for most services. The platform’s root-cause analysis panels break a flagged anomaly down by project, SKU, and service so you’re not guessing at what changed. For AI and machine learning workloads specifically, the early-anomaly path uses estimated costs precisely because waiting for finalized billing would cause detection delays, potentially discovering issues too late.
On Azure and Oracle Cloud Infrastructure, native anomaly detection has matured more recently and generally offers sensitivity sliders rather than the granular monitor types AWS provides. Expect fewer AI-specific early-warning paths today, though that gap is closing fast as every major vendor races to cover generative AI spend. Third-party platforms like Datadog’s Cloud Cost Management fill some of this space by detecting and prioritizing anomalies across providers in one pane, with built-in investigation helpers and noise filters that work regardless of which cloud generated the spend.
A practical setup checklist looks roughly the same everywhere, even though the menu names differ:
- Grant the detector read access to billing and cost export data (never write access; anomaly detection doesn’t need permission to touch resources).
- Choose your monitoring scope deliberately. Account-wide catches everything but drowns you in low-value alerts; scoping to specific services or tags gives cleaner signal faster.
- Set an initial cost-impact floor high enough to filter noise, then tighten it over the following weeks as you learn your environment’s real volatility.
- Route the first alert subscription to a channel your on-call team actually watches. An alert that lands in an unread inbox is worse than no alert.
- Revisit sensitivity after 30 days of live data, once the model has a real baseline instead of a cold start.
If your organization already struggles to see spend clearly across multiple providers, that’s worth solving before anomaly detection, not after. Multi-cloud billing visibility gaps tend to hide the exact tagging and account-structure problems that make anomaly investigation slow later.
How Do You Tune Alerts So You Get Signal, Not Noise?
The single biggest reason teams abandon cost anomaly detection isn’t a bad model. It’s alert fatigue. A detector that pages someone for every $30 blip trains your team to ignore it within two weeks, which defeats the entire purpose.
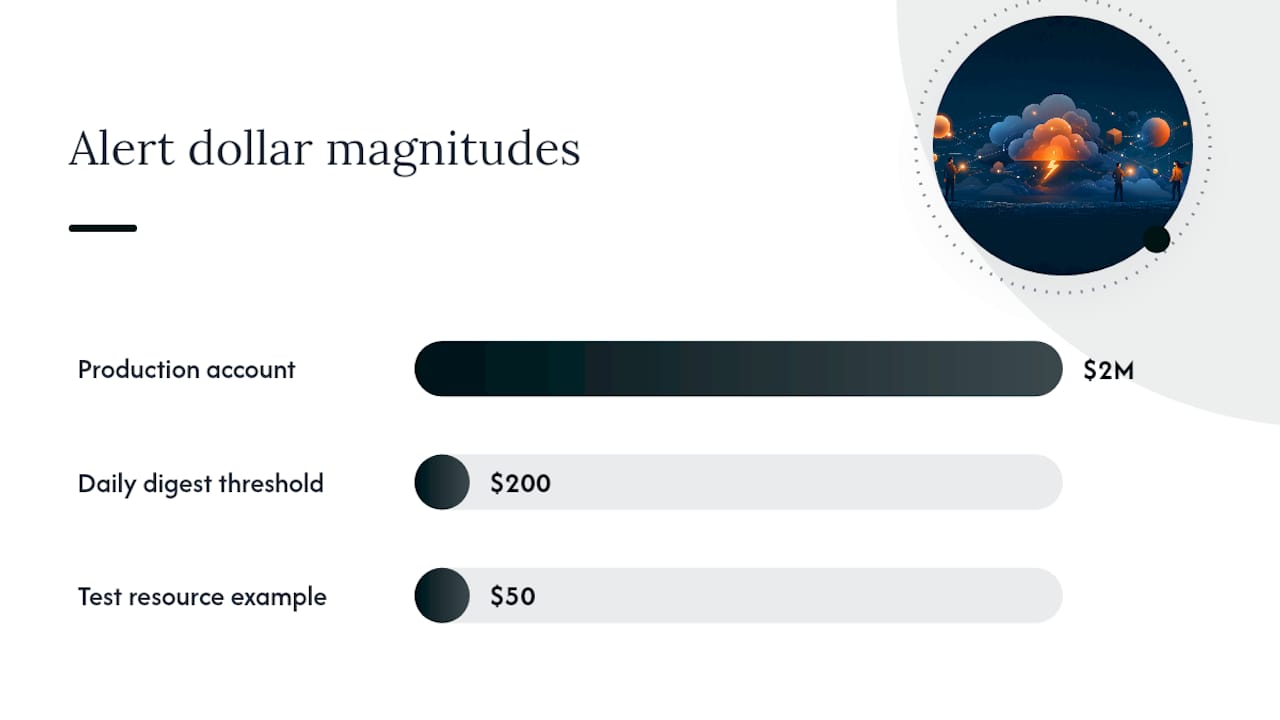
Threshold dimensions matter more than most teams realize at setup time. Percent deviation alone misleads you at scale: a 200% increase on a $50 test resource is noise, while a 15% increase on a $2 million production account is a five-figure problem. Cost impact, the raw dollar swing, is usually the better primary filter, with percent deviation as a secondary signal for smaller accounts where dollar floors alone would miss real issues.
Report scope shapes alert volume just as much as thresholds do. A narrow scope, like a single tag or project, produces fewer but more specific alerts. A broad, account-wide scope catches more but forces every investigator to spend time figuring out which service actually moved. Most mature FinOps teams start broad to establish a baseline, then narrow scope around the services that generate the most false positives or the highest business risk.
Delivery channel choices affect adoption more than any model tuning ever will:
- Immediate alerts for anything above a high cost-impact threshold, routed to whoever owns on-call that week.
- Daily digest for lower-impact anomalies, so people aren’t context-switching every hour for a $200 deviation.
- Escalation policies that automatically bump an unacknowledged high-impact anomaly to a manager after a set window.
Pro Tip: Group anomalies by root cause before they hit a human. A single misconfigured autoscaling policy can generate a dozen separate line-item anomalies across regions. Grouped, that’s one ticket. Ungrouped, it’s twelve pages at 2 a.m. for the same underlying issue.
Minimum-dollar floors and grouping logic aren’t optional refinements. They’re what determines whether your team still trusts the anomaly feed six months from now.
How Do You Investigate a Cost Anomaly Once It’s Flagged?
Speed matters here, but so does discipline. A rushed investigation that misdiagnoses the cause wastes more time than a slightly slower, correct one.
- Open the anomaly and read the root-cause breakdown first. Most detectors, including AWS’s and Google Cloud’s, surface the specific service, region, project, or SKU driving the deviation before you touch anything else.
- Check for recent deploys, config changes, or scheduled jobs. The majority of cost anomalies trace back to something a human or a pipeline changed in the prior 24 to 48 hours, not a mysterious external event.
- Cross-reference usage against committed discounts. A spike that looks alarming in raw dollars sometimes just means you burned through a Reserved Instance commitment early, which changes the remediation entirely. Unused or exhausted committed discounts are a common false alarm that looks like waste but is actually a purchasing problem.
- Classify the anomaly. Active means it’s still happening and needs attention now. Past means the spend event already ended, useful for the postmortem but not urgent. Resolved means someone already fixed the root cause and the classification is just for the record.
- Decide: auto-remediate, escalate to engineering, or close as expected. Reserve automated remediation for low-risk, reversible actions, like throttling a non-critical job. Anything destructive, terminating instances or deleting resources, needs a human to sign off first.
- Log the resolution and feed it back to the detector. Marking a resolved anomaly as expected or unexpected trains the model, and it’s the single easiest way to reduce false positives on that resource going forward.
Pro Tip: Keep a running log of resolved anomalies with their root cause tagged, even the boring ones. Six months in, that log becomes your best evidence for whether a “one-time” spend pattern is actually recurring.
Kubernetes environments deserve a specific mention here, since container cost drivers are notoriously hard to attribute at the billing-line level without proper labeling, which makes root-cause analysis slower unless the labeling was done up front.
What Does an Operational Playbook for Anomaly-Driven FinOps Look Like?
Detection without an operating model just generates alerts nobody acts on consistently. Turning anomaly detection into a real capability means assigning ownership, setting SLAs, and deciding in advance what gets automated and what requires a human.
Ownership should be explicit, not assumed. Someone, usually a FinOps lead or a designated on-call engineer, owns triage within a defined SLA window: 15 minutes for anomalies above your highest cost-impact tier, same business day for mid-tier, and weekly digest review for the low-impact long tail. Without a named owner, anomalies sit in a queue until someone notices the invoice.
A simple prioritization matrix, cost impact crossed with business criticality, keeps engineering focused on what actually matters instead of chasing every flagged deviation with equal urgency. A $50,000 spike on a revenue-generating production service outranks a $50,000 spike on a decommissioned test environment, even though the raw numbers look identical.
Automation earns its place here, but only with guardrails. Rate-limiting a runaway API, pausing a non-critical batch job, or enforcing a tagging policy are reasonable automated responses. Terminating production instances or deleting storage should stay behind a human approval gate, full stop. Every automated action and every manual decision needs to land in an immutable log, both for audit purposes and because that history is exactly what improves the detector’s accuracy over time.
| Playbook element | What it does | Why it matters |
|---|---|---|
| Ownership and SLAs | Assigns a named owner and response window by severity tier | Prevents alerts from sitting unaddressed in a shared queue |
| Prioritization matrix | Ranks anomalies by cost impact and business criticality | Focuses engineering time on what actually threatens the budget |
| Gated automation | Allows reversible actions automatically, requires sign-off for destructive ones | Balances speed against the risk of an automated mistake |
| Immutable logging | Records every anomaly, decision, and outcome | Supports audits and trains the detector on real feedback |
| Leadership reporting | Summarizes remediated spend and recurring patterns monthly | Turns detection into a budgeting and forecasting input, not just an alert feed |
Reporting outcomes to finance closes the loop. A monthly summary of anomalies caught, dollars saved through early remediation, and recurring patterns worth fixing at the architecture level turns anomaly detection from a technical control into a budgeting input finance actually trusts. That’s also where anomaly data starts improving forecast accuracy, since recurring false patterns get built into next quarter’s baseline instead of triggering the same false alarm every month. For teams managing this across multiple providers, a structured FinOps playbook helps standardize reporting format so finance sees one coherent story instead of three cloud-specific spreadsheets.
How Does EverythingCloud Operationalize Continuous Anomaly Detection?
Most teams don’t fail at anomaly detection because the models are bad. They fail because nobody owns the follow-through: the 2 a.m. alert that needs triage, the root-cause investigation that eats an afternoon, the remediation that never quite gets automated because everyone’s busy shipping something else.
Some platforms are designed to close that gap by providing continuous, 24/7 visibility across major cloud and SaaS workloads, so anomalies get caught and contextualized without waiting for someone to open a dashboard. Beyond detection, these platforms automate safe remediation actions and pair the rest with managed FinOps expertise, where analysts review high-impact anomalies instead of leaving triage entirely to a queue.
That approach maps directly onto the operational playbook above:
- Continuous monitoring replaces the periodic manual review that lets anomalies compound for weeks.
- Automated cost-saving actions handle the low-risk remediation tier, while human review gates anything higher-stakes.
- Governance aligned to CIS and NIST frameworks keeps remediation consistent with security and compliance requirements, not just cost targets.
- Monthly expert recommendations turn detection data into the kind of leadership reporting finance teams actually use.
Some managed FinOps offerings allow MSPs and technology partners to launch managed FinOps, cloud optimization, and AI optimization services under their own brand without building detection infrastructure from scratch, potentially opening recurring revenue streams on top of existing client relationships.
What Security and Compliance Issues Come Up With Cost Anomalies?
A cost spike is sometimes a security incident wearing a billing disguise. Compromised credentials used to spin up cryptomining instances, an exposed API key triggering runaway third-party API calls, or a misconfigured storage bucket generating unexpected egress charges: all three show up first as a cost anomaly, often before any security tool notices anything wrong. Treating anomaly detection purely as a FinOps concern misses that overlap.
That means triage workflows need a branch point: is this an engineering mistake, or does it look like unauthorized activity? A spike traced to an unfamiliar IAM role, a region your organization never operates in, or a service nobody on the team recognizes deserves an immediate handoff to security, not just a cost investigation ticket.
Compliance considerations layer on top. Governance frameworks aligned to standards like CIS and NIST increasingly expect organizations to demonstrate that cloud spend is monitored and unusual activity gets investigated on a defined timeline, since unmonitored spend is functionally unmonitored access in many audit frameworks. Immutable logging of every anomaly, its classification, and its resolution isn’t just useful for the FinOps team. It’s the audit trail that proves your organization was watching. Multi-tenant environments, common for MSPs managing several clients, add another layer: an anomaly on one tenant’s account should never leak cost or usage detail into another tenant’s view, which makes proper access scoping as important as the detection model itself.
What Actually Matters Going Into 2026
Early detection for AI workloads is the part most teams still underestimate. A fine-tuning job or an agentic pipeline can burn through a monthly budget in hours, and estimated-cost anomalies that surface in under an hour are becoming the difference between a $2,000 mistake and a $200,000 one.
The temptation is to automate everything once detection improves. Resist most of it. Automation without governance just moves the risk from “we spent too much” to “we shut down something critical without a human checking first.” The teams getting real value pair every detector with a written SLA and a remediation playbook that spells out exactly what gets auto-remediated and what waits for a person. Detection tells you something changed. Governance decides what happens next, and that’s the part too many FinOps programs skip.
— Dan
Get Continuous Anomaly Detection Without Building It Yourself
Everythingcloud is the managed path for teams that don’t want to spend a quarter building and tuning detection infrastructure before it delivers value. Instead of piecing together native tools across AWS, Azure, and Google Cloud, you get one platform with 24/7 monitoring, automated remediation for low-risk actions, and managed FinOps experts who review the anomalies that actually matter.
Customers see continuous visibility into cloud, SaaS, and AI spend, governance aligned to frameworks like CIS and NIST, and monthly recommendations that translate directly into measurable savings, without hiring a dedicated FinOps team from scratch. MSPs and technology partners get the same capability packaged as “FinOps in a Box,” letting you launch managed anomaly detection and cost optimization services under your own brand. If you’re ready to see what continuous, managed detection looks like for your environment, talk to Everythingcloud about managed FinOps and get a clear picture of where your cloud spend is currently exposed.
Where to Learn More About Cost Anomaly Detection
- Google Cloud’s Cost Anomaly Detection announcement covers hourly monitoring and detection timelines.
- AWS’s Cost Anomaly Detection setup guide walks through monitor types and alert subscriptions.
- Finops explains how anomaly detection complements budget controls.
- Google Cloud’s billing documentation on managing anomalies details early anomalies for AI workloads and estimated-cost handling.
- Datadog’s cloud cost anomaly documentation describes cross-provider detection and noise filtering.
Sources
- Introducing Cost Anomaly Detection | Google Cloud Blog
- Managing Cloud Cost Anomalies
- Getting started with AWS Cost Anomaly Detection
- Manage anomalies – Google Cloud Billing docs
- Real-Time Anomaly Detection For Cloud Cost Monitoring (Datadog docs excerpt)