
Accurate cloud cost visibility means driver-linked, near-real-time allocation across every account, region, and workload, not a monthly PDF from finance. Getting there requires cross-functional ownership and instrumented, amortized allocation, not another dashboard bolted onto the same fragmented billing data. Skip either one, and the visibility you build will quietly decay within a quarter.
TL;DR:
- Cross-functional ownership and tagging enforcement are critical to maintaining accurate cloud cost visibility beyond initial implementation.
- Budget forecasts should incorporate driver-based models using business events and planned changes rather than simple trend extrapolation.
- Regular governance, ownership, and validation routines are essential to prevent visibility decay and misallocation over multiple billing cycles.
- Unified multi-cloud and SaaS spend tracking requires third-party platforms since provider-native tools lack cross-provider visibility.
- Raw billing data must feed directly into budgeting and optimization processes, emphasizing the importance of reliable attribution and amortized views.
Table of Contents
- Why Cloud Cost Visibility Fails at Scale
- What Are the Core Components of Accurate Cost Visibility?
- How Do You Forecast Cloud Spend Without Getting It Wrong?
- What Governance Structure Keeps Visibility Operational?
- How Do You Measure Whether Visibility Is Actually Working?
- How Everythingcloud Puts This Playbook Into Practice
- What Are the Common Pitfalls in Implementing Visibility Programs?
- What Tools and Platforms Actually Support Cloud Cost Visibility?
- How Should Cost Visibility Data Feed Budgeting Systems?
- Does Visibility Actually Reduce Cloud Waste?
- What Do Successful Cloud Cost Visibility Rollouts Look Like?
- What Actually Separates Good Visibility Programs From Great Ones
- Ready to Fix Cloud Cost Visibility for Good?
- Sources
Why Cloud Cost Visibility Fails at Scale
Most enterprises don’t lack cost data. They drown in it, disconnected from the decisions that created it. Spend gets scattered across dozens of accounts, three cloud providers, and a SaaS stack finance never approved, with no thread linking a bill to the deployment that generated it.
Tagging is where visibility usually breaks first. Engineering teams tag consistently for a quarter, then a migration or a reorg introduces gaps, and nobody notices until a $40,000 line item shows up as “untagged” in a board deck. Shared infrastructure makes it worse: a shared Kubernetes cluster or a global load balancer serves five product lines, and there’s no clean way to split the bill without a rule someone actually defined.
The result is reporting that looks backward instead of forward:
- Finance discovers anomalies weeks after they happened, often during monthly close.
- Raw billed costs get treated as truth, even though commitments and discounts distort cash-based reporting and hide what a workload actually costs to run.
- Multi-cloud environments duplicate the problem three times over, with each provider’s console showing a different slice of reality.
None of this is a tooling failure. It’s a design failure, and it compounds every billing cycle it goes unaddressed.
What Are the Core Components of Accurate Cost Visibility?
Three terms get used interchangeably in FinOps conversations, and that sloppiness causes real damage. Attribution identifies who incurred a cost. Allocation assigns that cost to a business unit, product, or cost center, even when direct attribution isn’t possible. Granularity determines how finely you can slice the data, down to a resource, a tag, or a single Kubernetes namespace.
A concrete example: a shared Amazon Aurora cluster serving four internal services has clear attribution (the platform team owns it) but weak allocation until you define how each service’s usage gets split.
Build the model in this order:
- Define cost categories that mirror how the business actually thinks about spend, not how the cloud provider labels line items. AWS Cost Categories let you group and rename cost dimensions to match internal reporting structures.
- Set mandatory tag fields, typically cost center, owner, environment, and workload, enforced at provisioning rather than requested after the fact.
- Apply split-charge rules for costs that can’t be directly attributed, using proportional, fixed, or even splits depending on how defensible each method is for that resource. AWS Cost Categories supports all three natively.
- Standardize on amortized cost views for internal reporting, since amortized perspectives prevent false positives in optimization decisions that raw billed costs routinely create.
Pro Tip: Run allocation on both billed and amortized views for one quarter before retiring the billed report entirely. The gap between the two numbers is usually where your biggest commitment-purchasing mistakes are hiding.
How Do You Forecast Cloud Spend Without Getting It Wrong?
Trend-based forecasting is the default in most finance teams, and it’s also the reason most cloud budgets miss by a wide margin. Practitioners report trend-based models often carry 20% to 70% variance, because a straight-line projection of last quarter’s spend has no way to account for a new product launch, a migration, or a Black Friday traffic spike.
Driver-based forecasting fixes this by modeling cost against the business events that actually cause it, not the trend those events left behind.
To build one:
- Inventory planned drivers for the forecast period: new feature launches, planned migrations, headcount-driven usage growth, seasonal traffic events.
- Model each driver’s cost impact separately, using historical unit costs (cost per transaction, per user, per build) rather than aggregate spend trends.
- Layer in commitments and amortized costs, since Microsoft’s FinOps guidance and the FinOps Framework both recommend using amortized or effective cost views when forecasting, not the raw billed amount.
- Extend your horizon deliberately. AWS Cost Explorer now supports 18-month forecasts using up to 38 months of historical data, while Google Cloud Billing supports forecasting of future costs over an extended period at the project level. Enterprise planning benefits from capturing at least a full seasonal cycle in the historical window.
Statistic Callout: Forecast variance in trend-based models commonly lands between 20% and 70%, according to FinOps forecasting guidance, largely because those models have no mechanism to absorb planned engineering or business change before it happens.
What Governance Structure Keeps Visibility Operational?
Visibility built without governance decays fast, usually within one or two release cycles, because nobody owns keeping it accurate once the initial project ends.
The fix starts with a steering committee, not a single FinOps analyst carrying the whole program alone. That committee needs engineering, product, and finance in the room together, because engineering creates the spend, product understands the business context behind it, and finance needs the numbers to close the books. AWS guidance on driver-based forecasting points to this cross-functional structure as a direct driver of forecast accuracy.
From there, assign ownership at the team level, ideally to units small enough to feel direct accountability for their spend, similar to Amazon’s “two-pizza team” model.
Sustained governance runs on a few concrete mechanisms:
- Tag-or-terminate enforcement built into provisioning pipelines, not a policy document nobody reads.
- Automated remediation workflows for missing or incorrect metadata.
- Budget alerts tied to specific owners, not a shared inbox that gets ignored.
- Scheduled reconciliation reviews where the steering committee resolves allocation disputes before they calcify into “that’s just how we’ve always reported it.”
How Do You Measure Whether Visibility Is Actually Working?
You need a small set of KPIs that tell you whether visibility is improving or quietly rotting, tracked monthly and reviewed by the same steering committee that owns governance.
- Allocated coverage: the percent of total spend mapped to a specific owner, versus the percent still sitting in an “unallocated” bucket.
- Forecast variance: the gap between forecasted and actual spend, with an acceptable error band defined per business unit rather than one blanket target.
- Time-to-detect and time-to-remediate anomalies: how long it takes to spot an unexpected spend spike and close the loop on it.
- Tag completeness and data freshness: how current your cost data is relative to actual usage, since stale data undermines every decision built on it.
Statistic Callout: Microsoft’s FinOps guidance names tag completeness, allocated spend percentage, forecast variance, and time-to-detect anomalies as the core operational KPIs FinOps teams should track, not vanity metrics like total dashboards built or reports generated.
Outcome metrics matter just as much: how many optimizations actually shipped, how much of the identified savings got realized versus stayed theoretical, and how quickly allocation disputes between teams get resolved rather than lingering into the next quarter’s budget fight.
How Everythingcloud Puts This Playbook Into Practice
Everythingcloud’s platform exists because most enterprises can build every piece of this playbook in principle and still fail to sustain it in practice. The platform ingests billing exports, telemetry, SaaS spend, and AI token consumption into one unified model, so allocation doesn’t depend on stitching together three provider consoles by hand.
Key capabilities map directly to the practices above:
- Amortized cost views by default, not as a manual override analysts have to remember to apply.
- Split-charge rules for shared infrastructure, validated against usage proxies rather than arbitrary even splits.
- Multi-tenant controls purpose-built for MSPs running managed FinOps across many client environments at once.
For MSPs and enterprise IT teams without the bandwidth to build this internally, the operational model is “FinOps in a Box”: rollout typically starts with billing and tag audits, moves into automated allocation and anomaly detection, and layers in governance guidance for cross-functional teams once the data foundation is stable.
Pro Tip: Treat the first 30 days of any rollout as a data-quality sprint, not an optimization sprint. Savings recommendations built on bad allocation data will send you chasing the wrong workloads.
What Are the Common Pitfalls in Implementing Visibility Programs?
Most visibility programs don’t fail because of bad tooling. They fail because of predictable organizational patterns that repeat across nearly every enterprise rollout.
The most common one is treating visibility as a one-time project instead of an ongoing operational discipline. A team spends a quarter cleaning up tags and building dashboards, declares victory, and then watches coverage erode within two release cycles because nobody owns maintaining it.
A close second is over-indexing on granularity before allocation is solid.
Ownership ambiguity causes just as much damage. When a cost category has no clear owner, disputes over “whose budget line is this” consume more time than the actual optimization work would have taken.
Provider-native tools also get overtrusted. AWS, Azure, and Google Cloud each provide solid first-party cost tools, but none of them natively unify multi-cloud or SaaS spend into a single model, which leaves gaps for organizations running more than one provider.
Finally, many programs skip validation on split-charge and allocation rules entirely. A proportional split that made sense a year ago, before a major architecture change, can silently misallocate tens of thousands of dollars a month if nobody revisits the underlying assumption.
What Tools and Platforms Actually Support Cloud Cost Visibility?
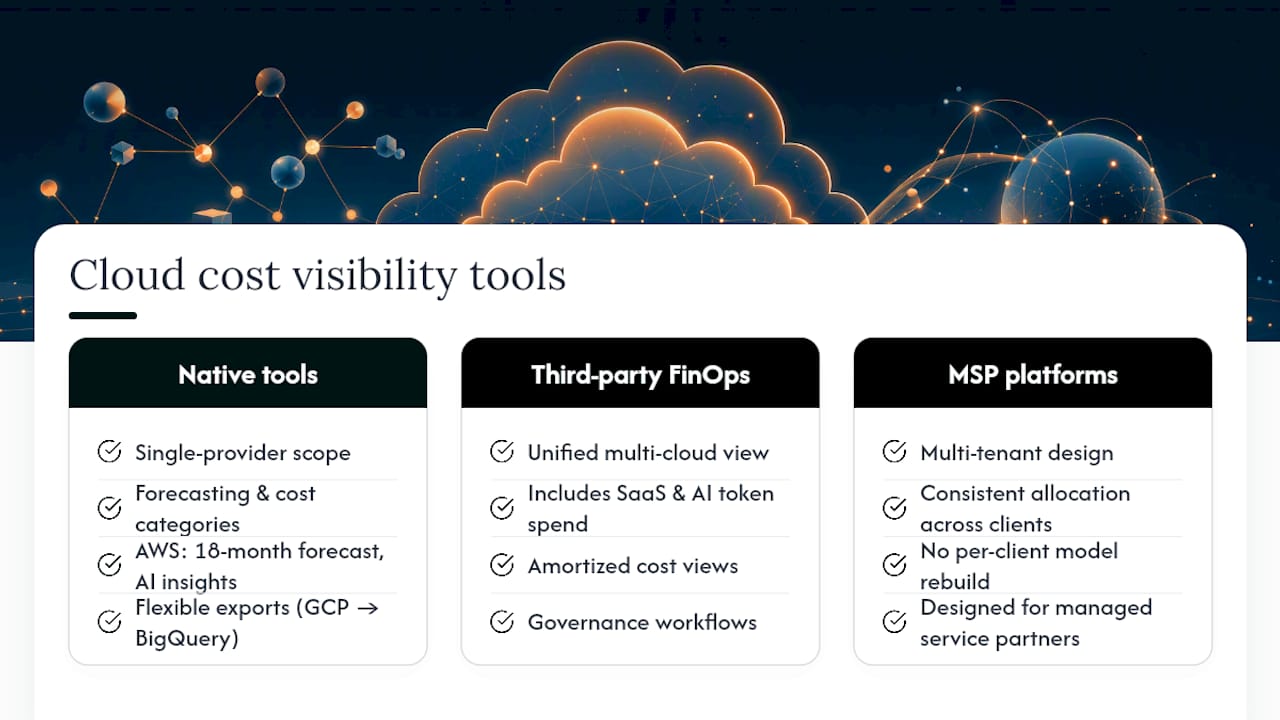
Provider-native tools are a reasonable starting point, but they were built to visualize spend within one cloud, not across the multi-cloud, multi-SaaS reality most enterprises actually run.
AWS Cost Explorer, Azure Cost Management, and Google Cloud’s Billing reports each handle single-provider forecasting and basic cost categorization well. AWS Cost Explorer’s extended 18-month forecasting and explainable AI insights are genuinely strong for AWS-only workloads. Google Cloud’s billing exports to BigQuery give technical teams a flexible foundation for custom modeling.
The gap shows up the moment an organization runs two or more providers alongside a SaaS stack and AI workloads. That’s the territory third-party FinOps platforms exist to cover: unified allocation across AWS, Azure, Google Cloud, Microsoft 365, and AI token spend, with amortized views and governance workflows that no single provider’s console will ever build, since none of them has an incentive to make competitors’ spend visible alongside their own.
For MSPs specifically, multi-tenant managed FinOps platforms solve a different problem entirely: running consistent allocation and governance across dozens of client environments without rebuilding the model for each one. That’s a structural need provider-native tools were never designed to address, since they’re scoped to a single account or organization, not a partner’s entire client base.
How Should Cost Visibility Data Feed Budgeting Systems?
Visibility data that lives only in a cost dashboard never reaches the people who set next year’s budget, and that disconnect is where most FinOps programs lose their influence.
The fix is treating allocated, amortized cost data as an input to financial planning systems, not a separate reporting stream finance checks occasionally. When product-level cost data flows into the same planning cycle as headcount and revenue forecasts, budget owners can see the actual unit economics behind a product line rather than negotiating budgets based on last year’s number plus a flat percentage.
This works best when the cadence matches. If finance runs quarterly budget reviews, cost visibility data needs to be reconciled and validated on that same quarterly rhythm, not left stale from a monthly export that predates the review by six weeks.
Driver-based forecasts, built from the planned migrations and feature launches engineering already knows about, give budgeting systems something trend lines can’t: a forward-looking number tied to actual business plans rather than a straight-line extrapolation of last quarter’s bill.
The organizations that get this right treat the steering committee described earlier as the bridge between the two systems. Engineering and product bring the drivers. Finance translates them into budget lines. Nobody is guessing.
Does Visibility Actually Reduce Cloud Waste?
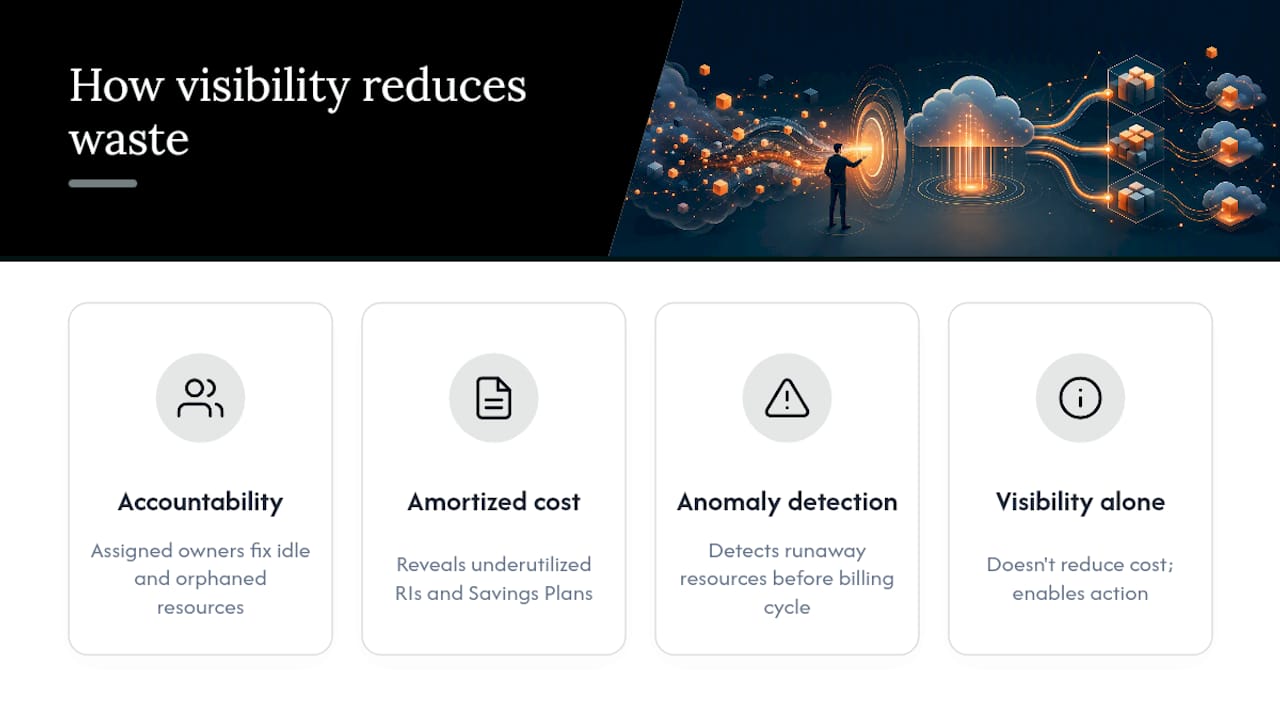
Visibility on its own doesn’t cut a single dollar of waste. What it does is make waste visible enough that someone with authority to act actually sees it, which is a prerequisite optimization can’t skip.
Once spend is allocated to a specific owner, idle resources, oversized instances, and orphaned storage volumes stop being an abstract line item on a shared bill and become a specific team’s problem to fix. That shift in accountability is often what drives action faster than any automated recommendation engine.
Amortized cost views expose a second category of waste that raw billed costs hide entirely: underutilized commitments. A Reserved Instance or Savings Plan that looked like a smart purchase eighteen months ago can quietly stop matching current usage patterns after a migration or an architecture change, and without amortized reporting, nobody notices until the next commitment renewal.
Anomaly detection built on granular, near-real-time data catches a different problem: the runaway resource, a forgotten test environment, a misconfigured autoscaling group, before it accumulates a full billing cycle of waste. Enterprises with mature detection pipelines close that gap in days rather than discovering it during month-end close.
None of this happens automatically just because a platform ingests billing data. It happens because visibility gives specific, accountable owners a reason to act, and gives the steering committee a way to measure whether they actually did.
What Do Successful Cloud Cost Visibility Rollouts Look Like?
The enterprises that get this right share a consistent pattern, regardless of which cloud provider or industry they operate in.
They start narrow. Rather than trying to achieve perfect allocation across every account on day one, successful programs pick one business unit or product line, get allocation and tagging solid there, and use that as the template for the rest of the organization. Trying to fix everything at once is the fastest way to stall a program before it produces a single usable report.
They fix the data before they chase savings. Teams that jump straight to optimization recommendations on top of shaky allocation data end up acting on numbers nobody trusts, which erodes confidence in the entire program within a month.
They put governance in place before the dashboards, not after. A steering committee that meets before rollout, agrees on tag standards and ownership before deployment, avoids the retrofitting fights that plague programs where engineering builds first and finance asks questions later.
They measure the boring metrics relentlessly. Tag completeness and allocated coverage aren’t exciting numbers to report, but the organizations with the best forecast accuracy are consistently the ones that treated those unglamorous metrics as non-negotiable from month one, not as cleanup work to get to eventually.
What Actually Separates Good Visibility Programs From Great Ones
The gap between an enterprise that talks about FinOps and one that runs it well isn’t tooling. Every organization I’ve seen struggle with cloud costs had access to solid cost data. What separates the programs that work is whether anyone with real authority owns the outcome.
Three things matter more than anything else. Assign ownership before you buy a single tool, since a platform can’t fix an accountability gap. Instrument cost against business drivers, not against the cloud provider’s arbitrary service categories. Automate tag hygiene at the provisioning layer, because manual tagging discipline degrades the moment the team that started it gets reorganized.
I’ve watched two mistakes repeat across nearly every enterprise rollout. Teams chase resource-level granularity while a third of spend sits unallocated, and teams treat a one-time tagging cleanup as a finished project instead of an operating discipline. Both get fixed the same way: someone senior enough decides visibility is a permanent line item on someone’s job description, not a quarterly initiative.
Start this week by picking one product line, assigning one accountable owner, and getting its allocation to 90% coverage before you touch a second one.
— Dan
Ready to Fix Cloud Cost Visibility for Good?
Everythingcloud exists for the exact gap this guide keeps circling back to: enterprises and MSPs that know what accurate visibility requires but don’t have the bandwidth to build and maintain the pipeline themselves. The platform delivers real-time, amortized allocation across AWS, Azure, Google Cloud, Microsoft 365, and AI token spend, with split-charge rules and governance workflows built in rather than bolted on after the fact.
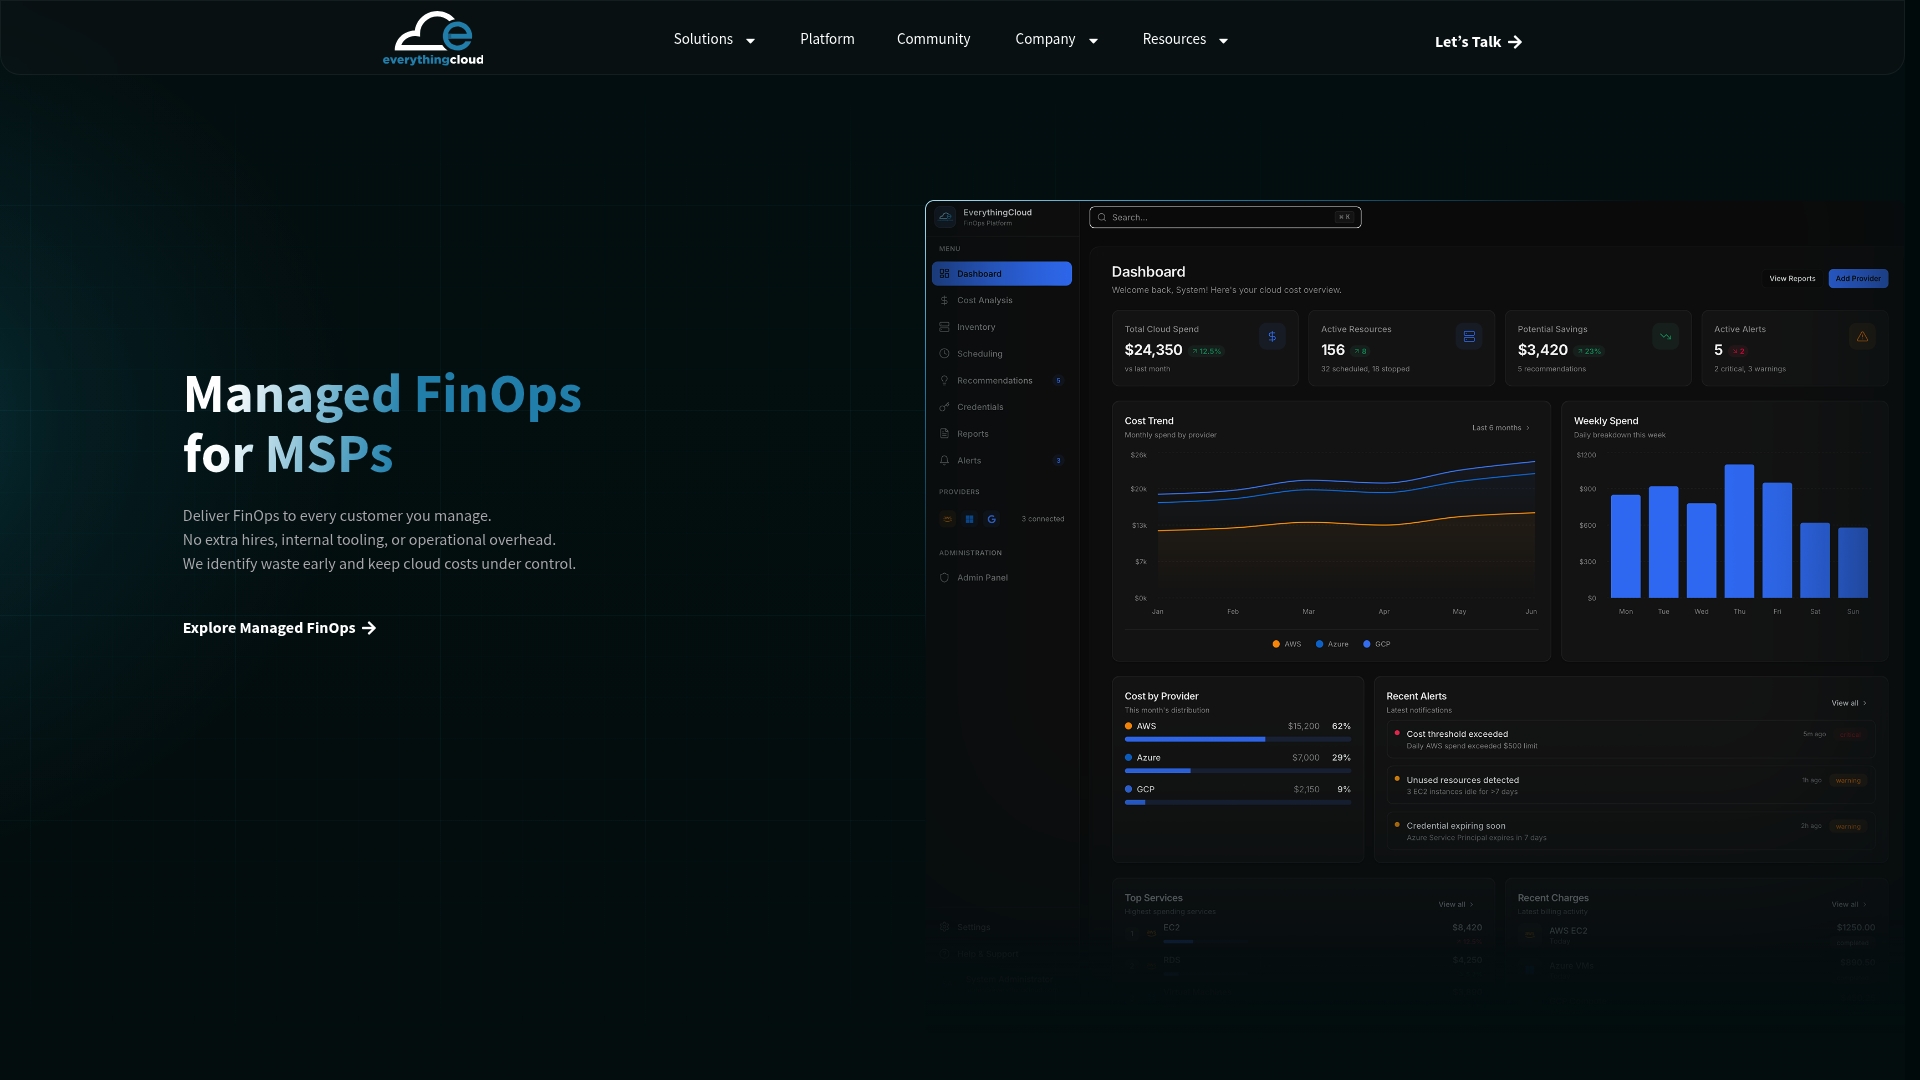
If you’re a cloud financial manager wrestling with fragmented multi-cloud reporting, or an MSP looking to launch managed FinOps without building the stack from scratch, Managed FinOps for MSPs is built specifically for that rollout, multi-tenant controls included. Mid-to-large enterprises with complex AI or multi-cloud spend get the same amortized allocation and driver-based forecasting this guide walks through, backed by 24/7 monitoring instead of a quarterly cleanup sprint.
Get in touch with the team to talk through your current allocation gaps and where a managed FinOps engagement would start.
Sources
Visibility is only as good as the pipeline feeding it, and most enterprises underinvest in that pipeline while overinvesting in the dashboard on top of it.
Provider billing exports are the canonical source of truth. Exporting AWS Cost and Usage Reports, Azure Cost Management exports, or Google Cloud Billing data into a data warehouse (BigQuery is the common destination for Google Cloud shops) gives you a queryable, historical record that survives longer than any single provider’s console retention.
Billing data alone tells you what something cost, not why. Linking observability and CI/CD metadata, deployment IDs, service ownership, release tags, to that billing data lets engineers see cost in the same context they see latency or error rates. That context is what turns a cost report into something an engineer actually acts on.
For the costs that resist clean attribution:
- Introducing 18-Month Forecasting and Explainable AI Insights in AWS Cost Explorer
- FinOps forecasting guidance
- Forecasting: FinOps Framework (Microsoft doc)
- FinOps WG: forecasting cloud costs
- Improve cost visibility with AWS Cost Categories (Part 1)