
SaaS usage analytics is the practice of measuring how people actually use the applications your organization pays for: who is active, which features they touch, how often, and what each seat costs against that activity. Done well, it tells you which licenses to reclaim, which overlapping apps to consolidate and which renewals to renegotiate. Done badly, it produces a dashboard nobody opens.
The phrase means two different things online. Product teams use it to study how customers behave inside the software they build. Finance, IT and MSP teams use it to study how employees use the software they buy. This article covers the second meaning, and it explains where the first one differs so you can tell which tools and metrics you need.
TL;DR
- SaaS usage analytics for buyers measures active behavior (logins, time in app, feature use), not the number of licenses you hold.
- Usage data alone rarely includes cost, so the real value comes from joining it with invoice and contract data.
- A small set of metrics, tracked over a rolling 30-day window, is enough to find unused seats, overlapping apps and renewal leverage.
- Every dashboard needs an owner and a defined response, or the data never turns into savings.
- Govern the process: user lifecycle, review cadence and renewal timing matter as much as the tooling.
Table of Contents
- Two meanings of SaaS usage analytics
- Why usage data matters more than license counts
- The metrics worth tracking
- Where the data comes from
- Turning usage data into savings
- Building a dashboard people use
- Governance, privacy and data quality
- Our perspective
- Put usage analytics to work with EverythingCloud
- FAQ
- Sources
Two meanings of SaaS usage analytics
Search results for this term mix two audiences, so it helps to separate them.
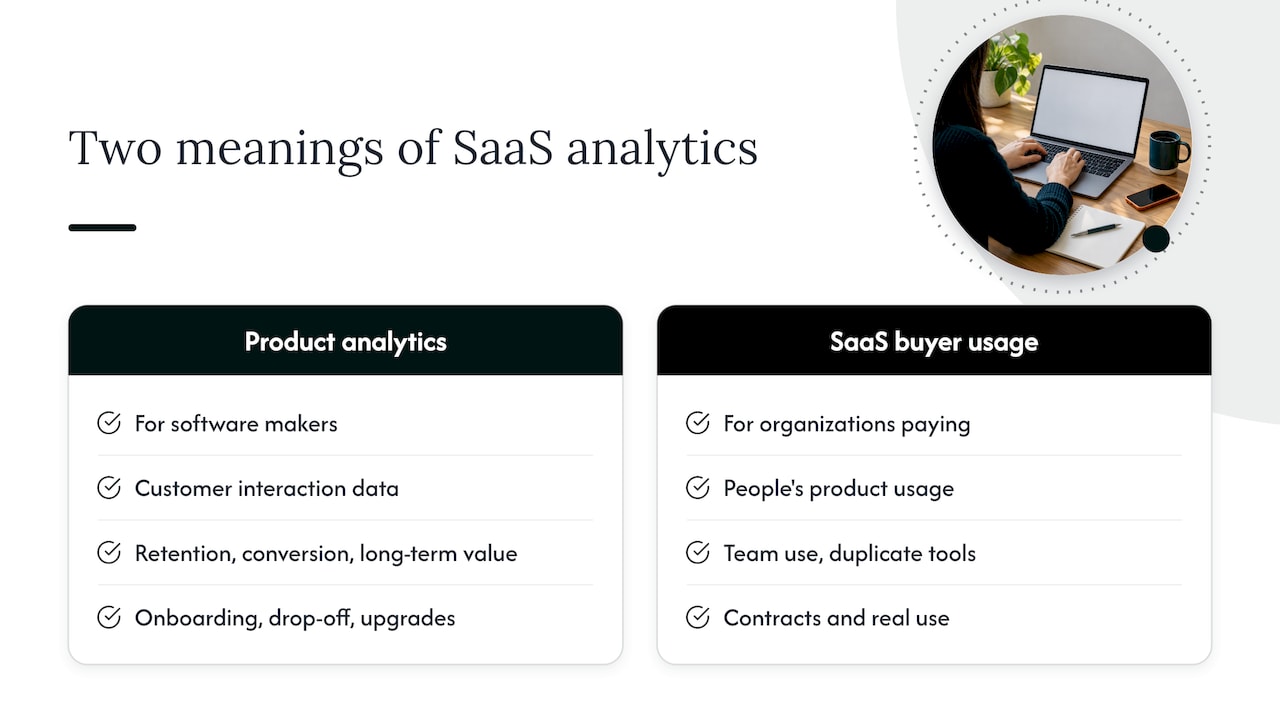
Product analytics is built for the company that makes the software. It gathers and transforms user-level data to show how customers interact with a product, and to understand retention, conversion and long-term value, as TechTarget’s overview of product analytics describes it. The questions are about onboarding, drop-off and which features drive upgrades. Behavioral analytics for product teams is a good starting point if that is the problem you are solving.
Usage analytics for SaaS buyers is built for the organization that pays for the software. Stripe’s explainer on usage analytics frames the general idea as studying what people do inside a product, including feature adoption, repeat patterns and drop-off points. Applied to your own stack, the same lens answers a different set of questions. Is the team using the tool we bought? Are three departments paying for three tools that do the same job? Which contract renews next quarter, and what do we know about its real use?
If you run IT, finance, procurement or an MSP, the second meaning is yours. Everything below is written for that reader.
Why usage data matters more than license counts
A license count tells you what you bought. It says nothing about what anyone does with it.
That gap is where spend quietly leaks. A seat assigned to a former contractor, a premium tier used for one basic feature, a second project tool adopted by a team that never heard about the first: none of these show up in a purchase order. They show up only in activity data.
Nexthink’s documentation makes the same point in its guidance on adoption: its metrics are based on active application usage, not on the total number of licensed users, according to the Nexthink adoption documentation. The same page notes that adoption should be read from behavior and trends. A stable user count paired with falling usage time can signal that engagement is slipping, even though the license report looks healthy.
That is the first rule of SaaS usage analytics: trust activity, not assignment.
The metrics worth tracking
You do not need fifty charts. Start with a short list and a consistent time window.
Nexthink’s guidance points to employee counts, usage time per employee per day, adoption across organizational groups and usage of application features, all tracked over a rolling 30-day period (Nexthink). That is a sound base. Here is how each one earns its place.
Active users against licensed users
This is the ratio that exposes shelfware. If you hold 500 seats and 310 people were active in the last 30 days, you have a conversation to start with the app owner. Define “active” before you measure: a login is a weak signal, while a meaningful action (a record edited, a message sent, a report run) is a stronger one.
Usage time per person per day
Time in app separates the daily driver from the occasional visitor. A tool used for four minutes a week may not need a premium tier, or may not need a seat for that person at all. Watch the trend too. Flat headcount with shrinking time per person is an early warning that the app is being replaced informally by something else.
Adoption by team or department
Overall averages hide the truth. A collaboration platform with 80% adoption in engineering and 12% in sales is two different stories. Segment by group so you can decide whether to train, reassign or remove.
Feature usage
Feature-level data tells you which plan you actually need. If a team pays for an enterprise tier but only uses features available in a cheaper one, the renewal is your moment to move down. If a feature is widely used and a competing tool covers the same job, you have a consolidation candidate.
Cost per active user
This is the metric most usage tools omit, and it is the one finance cares about. Divide what you pay by the people who really use the app. A $40 seat used daily may be cheaper in practice than a $9 seat used twice a quarter.
Where the data comes from
Usage data comes from several places, and none is complete alone.
The FinOps Foundation’s guidance on applying the FinOps Framework to SaaS explains that SaaS usage data may include account, service or function-level details such as the number of active user licenses, storage use and function-call counts. Unlike data from cloud service providers, it may not include the associated cost. That one sentence explains why so many usage reports feel unfinished.
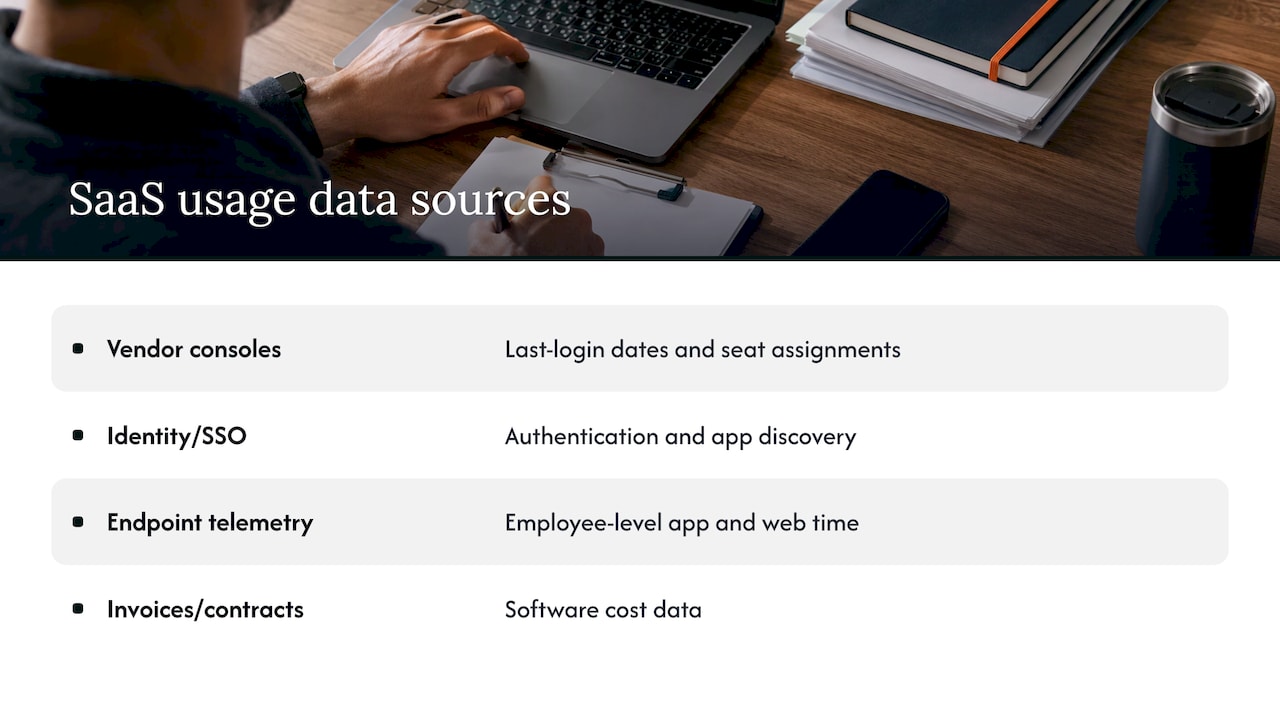
In practice, you assemble four layers:
Vendor admin consoles. Most SaaS vendors report last-login dates and seat assignments. The detail varies widely by vendor and by plan.
Identity and single sign-on logs. These show who authenticated to what, and they cover apps that have no useful reporting of their own. They also reveal apps nobody told IT about.
Device and endpoint telemetry. This captures time in app and web usage at the employee level, which is how adoption metrics like usage time per day are produced.
Invoices, contracts and expense data. This is the cost layer. Without it, you can say an app is underused but not what that underuse is worth.
The analysis starts to pay off when these layers are joined on a common key, usually the app and the user. A usage report with no cost is a curiosity. A cost report with no usage is a bill. Together they are a decision.
Turning usage data into savings
Collecting data is the easy half. The harder half is acting on it. This is the sequence we see working for mid-market teams.
Step 1: Inventory every app, including the ones you did not buy
SaaS buying is decentralized. Departments swipe a card, expense the subscription and move on. Start from identity logs and expense data, not from the procurement list, so you find the real footprint. Our guide on SaaS spend management for finance, IT and procurement walks through how to bring those owners to one table.
Step 2: Set an inactivity threshold per app
Pick a window that fits how the tool is used. Thirty days suits a daily messaging platform. A tool used for quarterly planning needs a longer look. Write the threshold down, because it becomes the rule for reclaiming a seat.
Step 3: Flag unused and underused seats
List users who fall below the threshold, group them by app and attach the seat cost. Send each app owner the list with a clear question: reclaim, downgrade or keep with a reason. Never reclaim silently. A seat that looks idle may belong to someone on leave or someone who needs the tool for an annual task.
Step 4: Find overlap
Compare apps by purpose, not by name. Two video tools, three whiteboards and four project trackers are common. Use feature usage and adoption by team to decide which one wins, and plan the migration so the losing tool is not simply left running.
Step 5: Bring the data to renewal
Usage evidence changes the negotiation. Walking into a renewal knowing your true active count lets you right-size the contract before you commit to another term. We cover the timing in our 90-day SaaS renewal playbook for mid-market teams, and the vendor-specific angle in our piece on Salesforce license optimization at renewal.
Step 6: Make reclamation a routine
The FinOps Foundation describes the mature version of this as reclaiming unused entitlements as a designed lifecycle step rather than an annual audit finding, with automated reclamation triggers tied to usage thresholds at the most advanced stage (FinOps Framework: Licensing and SaaS). You do not have to start there. Start with a quarterly review and automate the pieces that prove repetitive.
For a broader view of the levers beyond seat cleanup, see how to reduce SaaS costs without slowing your teams down.
Building a dashboard people use
Most usage dashboards fail for a simple reason: they show everything and answer nothing.
Brights, an engineering firm, suggests in its guide to analytics and reporting in SaaS products that dashboards are most actionable when built around one goal or decision, a small set of related metrics and context that shows whether a change is expected or a problem. The same guide recommends defining who owns each metric and what happens when it moves. We agree, and it applies directly to spend.
A practical layout for a SaaS usage dashboard has three views.
The executive view. Total SaaS spend, spend with measurable usage, estimated spend on inactive seats and the next ninety days of renewals. One screen, reviewed monthly.
The app owner view. Active against licensed users, usage trend, feature use and cost per active user for the apps that person owns. Reviewed monthly, with an action list.
The finance view. Spend by department, by vendor and by contract end date, with variance against budget. This one feeds forecasts.
For every chart, answer two questions in writing: who looks at this, and what do they do when the number moves? A metric with no owner is decoration.
Governance, privacy and data quality
Usage analytics touches employee behavior, so treat it with care.
Be clear on what you collect. Aggregated, app-level activity is usually enough for license decisions. Collect the minimum needed, tell employees what is measured and why, and involve your legal and HR teams before you roll out device-level telemetry. Rules differ by state and by employer policy, so confirm with counsel what applies to your workforce.
Put governance inside existing processes. The FinOps Foundation notes that governance should fit into processes for architecture review, planning and estimating, and forecasting for SaaS usage, and that strong policies are needed for usage optimization, especially around user management and general cost avoidance (FinOps Foundation). In plain terms: tie seat provisioning and removal to onboarding and offboarding, and require a usage case before a new tool is bought.
Check data quality before you act. Common traps include duplicate user identities across apps, service accounts that look like idle users, and vendors that report “last login” differently. Spot-check a sample against the vendor console before you send a reclaim list.
Keep the cost side honest. Savings you claim should tie back to invoices. A projected saving is an estimate. A lower invoice after renewal is a result.
Our perspective
Most teams treat SaaS usage as a reporting problem. We see it as an execution problem.
Visibility is where the work starts. Seeing that 30% of seats in an app are idle is useful, but the money only comes back when someone reclaims the seats, renegotiates the tier or cancels the duplicate before renewal. Recommendations that sit in a spreadsheet do not change the invoice.
That is why EverythingCloud is built around automating the execution of optimization actions, not just surfacing recommendations. Our approach pairs AI-powered software with Managed FinOps expertise, so usage, spend and governance sit in one view and the work continues month after month. Existing visibility tools can be integrated, so you keep what already works while owning the actions that follow.
We also believe savings should be verified against invoice-level billing. Usage analytics earns its keep when the number on the invoice moves.
For MSPs, the same logic applies at scale. Multi-tenant controls and unified reporting let you deliver SaaS optimization to every customer without hiring a team for each one.
Dan
Put usage analytics to work with EverythingCloud
If you want continuous monitoring, optimization and governance across cloud, SaaS and AI spend without building the process yourself, our Managed FinOps service pairs the platform with FinOps expertise that works your usage data every month. You can also see how The Platform brings spend visibility, anomaly detection and reporting into one place.
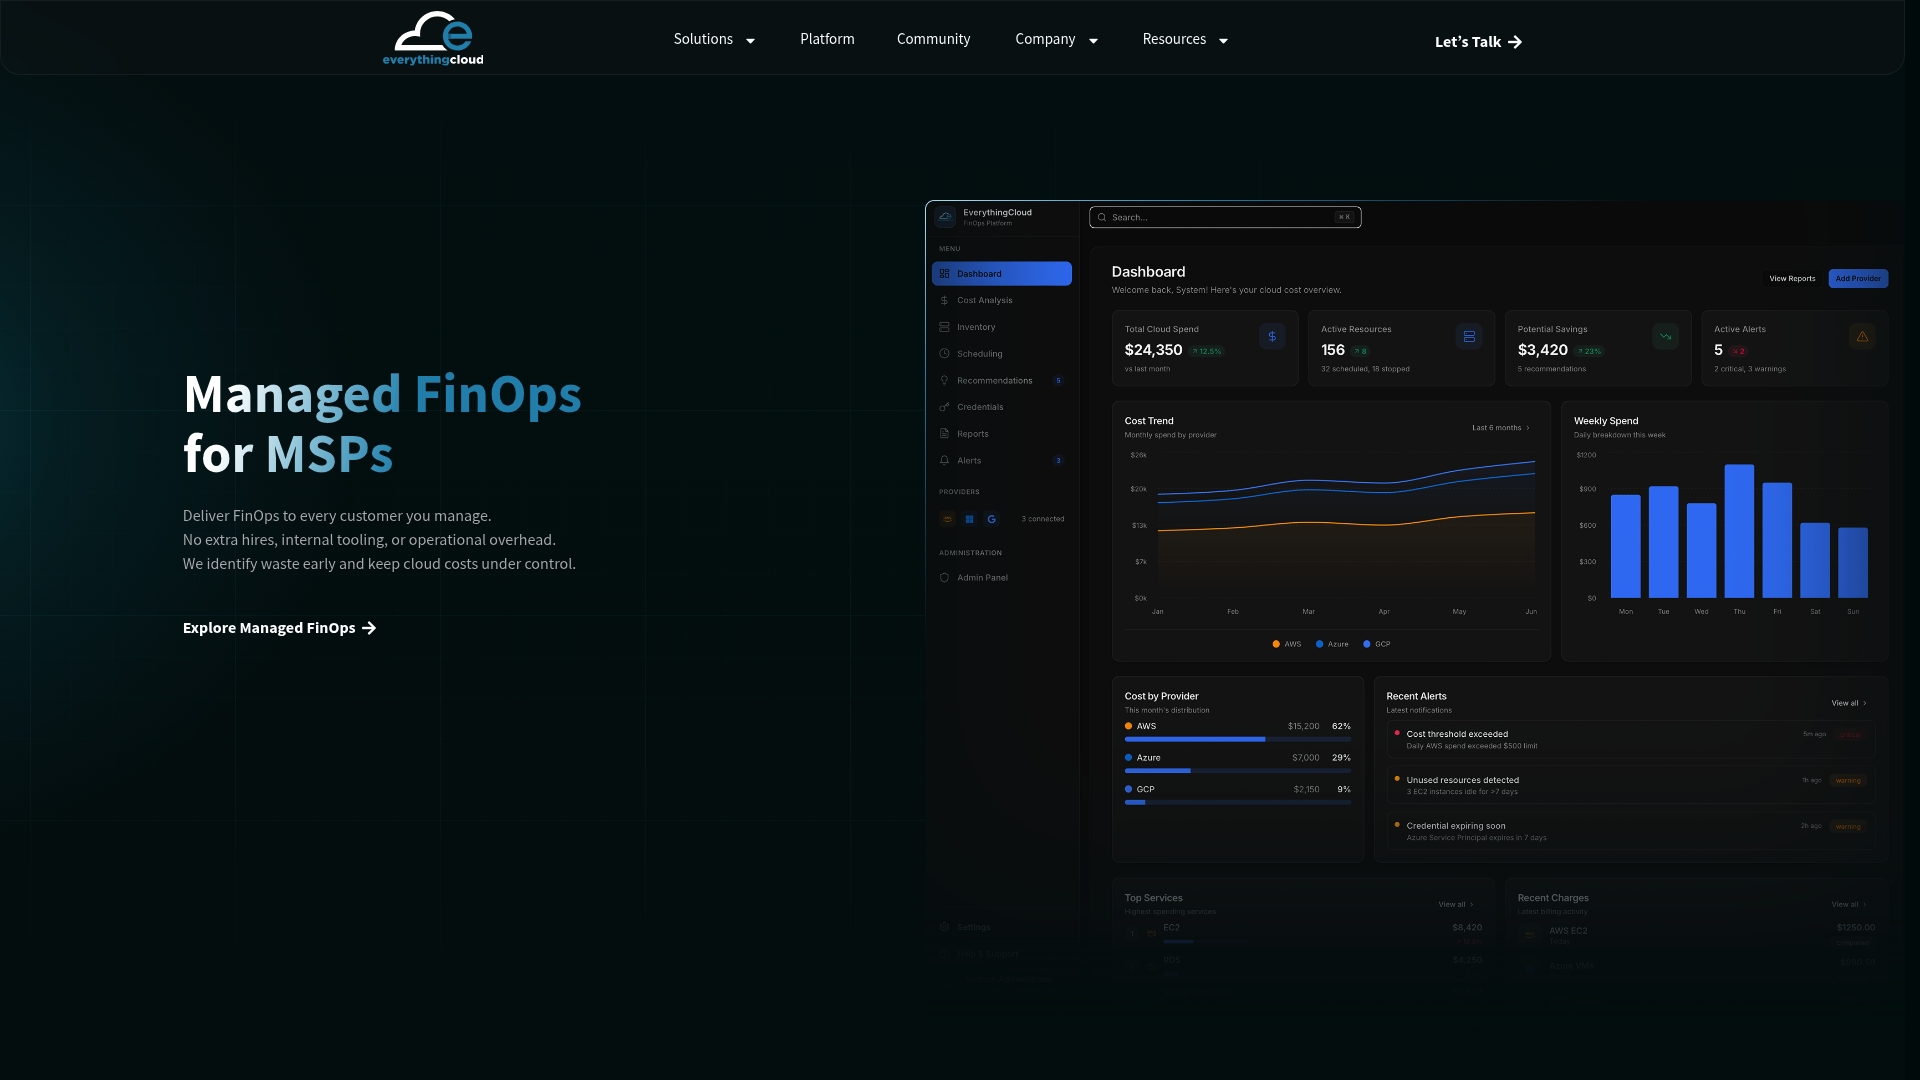
MSPs and channel partners can launch managed FinOps and SaaS optimization services for their own customers through the Founding Partner Membership, listed at $500 per month. It is built so you can add a recurring service without building a platform of your own.
FAQ
What is the difference between SaaS usage analytics and SaaS product analytics?
Product analytics serves the company that builds the software. It studies how customers behave inside the product to improve retention and conversion. Usage analytics for buyers studies how your employees use the apps you pay for, so you can manage adoption, licenses and spend.
Which metrics should I start with?
Begin with active against licensed users, usage time per person per day, adoption by team and feature usage, measured over a rolling 30-day window. Add cost per active user as soon as you can join usage data with invoices. That last metric is what turns an adoption report into a savings plan.
Why doesn’t my usage report show cost?
SaaS usage data typically covers items such as active licenses, storage and function calls, and unlike cloud provider data it may not carry cost information, per the FinOps Foundation. You need to combine it with invoices, contracts and expense records. Many teams do this in a FinOps platform or a shared spreadsheet at first.
How often should we review SaaS usage?
Monthly for the app owner view and the executive summary, and ahead of every renewal. Start the renewal review about 90 days before the contract ends so you have time to right-size or switch. Teams with many apps often automate the routine checks.
Can we do this without monitoring individual employees?
Often yes. App-level and team-level aggregates answer most license questions. Where you need user-level data to reclaim seats, limit it to what the decision requires, document the purpose and check with your legal team on the rules that apply to your workforce.
Sources
- What is product analytics, and why is it important? (TechTarget)
- Understand user behavior to optimize AI content strategies
- Usage Analytics for Businesses Explained (Stripe)
- Adoption (Nexthink Documentation)
- Applying the FinOps Framework to SaaS (FinOps Foundation)
- Licensing & SaaS FinOps Framework Capability (FinOps Foundation)
- Data Analytics & Reporting in SaaS Products (Brights)