
Unified visibility across every cloud, SaaS subscription, and AI workload is the only way to make cloud spend accountable to finance and engineering alike. If your bills still live in three provider portals and a spreadsheet, your first move is not a dashboard purchase. It’s consolidating billing exports into a central pipeline and normalizing that data to one schema, so every dollar gets attributed and anomalies surface fast.
TL;DR:
- Consolidating billing exports into a central pipeline is essential before investing in dashboards to ensure real-time accuracy and anomaly detection.
- Normalizing billing data using the FOCUS schema reduces engineering overhead and improves cross-cloud report consistency, provided mappings are validated regularly.
- Tagging gaps, especially with SaaS, AI workloads, and shared infrastructure, create blind spots that require targeted attribution rules and dedicated metering.
- Continuous monitoring with automated ingestion, attribution, and anomaly detection prevents spending surprises and sustains long-term visibility.
- Using a platform approach or managed services accelerates deployment, ensures compliance, and turns cloud spend data into actionable accountability.
Table of Contents
- What Multi-Cloud Cost Visibility Actually Means for FinOps
- The Core Components of Aggregation, Normalization, and Attribution
- Where Enterprises Lose Visibility First
- An Implementation Checklist That Actually Gets You There
- Why FOCUS and Data Normalization Change the Math
- Choosing the Right Architecture: Native Tools, Data Warehouses, or a Central Platform
- Turning Visibility Into Accountability Through Governance
- KPIs and Dashboards That Speak Each Audience’s Language
- How Continuous Monitoring Turns Visibility Into a Repeatable Motion
- Getting Multi-Currency Billing and Chargebacks Right
- Security and Compliance When Aggregating Cost Data
- Author Perspective: The Anti-Patterns That Quietly Sabotage Visibility Programs
- Get Continuous Multi-Cloud Visibility Without Building It Yourself
- Sources
- FAQ
What Multi-Cloud Cost Visibility Actually Means for FinOps
Multi-cloud cost visibility means seeing every dollar spent across AWS, Azure, Google Cloud, SaaS platforms, containers, and AI or token consumption inside one coherent view, rather than four disconnected ones. That scope matters. A team that only tracks compute and storage while ignoring GPU hours, API tokens, and Microsoft 365 licensing is working from a partial ledger, not a real one.
The payoff shows up in three places. Forecasting gets sharper because finance can model spend against actual usage trends instead of last quarter’s invoice total. Chargeback and showback become defensible, since every cost has an owner instead of landing in an “unallocated” bucket that nobody wants to explain. And optimization gets prioritized correctly, because a team can rank savings opportunities by dollar impact instead of guessing which cloud account looks expensive this month.
This benefits more than the FinOps team. Engineering leads use it to catch a runaway GPU cluster before month end. Finance uses it to close the books without a week of manual reconciliation. Executives use it to answer the one question that always comes up in a budget review: what did we actually get for this spend?
The Core Components of Aggregation, Normalization, and Attribution
Visibility starts with three technical layers, and skipping any one of them breaks the whole chain.
Aggregation means pulling billing exports from every provider on a regular cadence, not a monthly scramble. AWS, Azure, GCP, and Oracle Cloud Infrastructure each expose cost and usage data through native exports, and AWS’s cost management tooling includes forecasting, anomaly detection, and commitment recommendations that a central pipeline can ingest directly. Google Cloud offers a comparable path, exporting detailed billing data straight into BigQuery for analysis, alongside labels and a project hierarchy built for allocation.
Normalization takes those exports, each with its own field names, units, and currency, and maps them into one consistent schema. Without this step, a “vCPU hour” in one provider’s export doesn’t line up cleanly with the equivalent line item in another.
Attribution assigns every cost to an owner using a mix of methods:
- Native cloud tags applied at resource creation
- Virtual tags layered on top when native tagging is missing or inconsistent
- Allocation rules that split shared infrastructure costs by usage ratio
- Proportional splitting for costs that genuinely serve multiple teams, like a shared Kubernetes cluster or a data transfer bill
Special cases need their own handling. Serverless functions and containers often bill in units too granular for standard tagging. GPU instances and AI token consumption need dedicated metering, since a single inference call can span multiple billing events across a model provider and the underlying compute.
Where Enterprises Lose Visibility First
Most enterprises don’t lack cost data. They lack a way to trust it. These are the gaps that show up first:
- Spreadsheet consolidation. Someone on the FinOps team exports three provider invoices into Excel every month, and the resulting report is stale before it’s presented.
- Missing or inconsistent tags. Untagged spend often sits in double digits as a percentage of total cloud cost, and every untagged dollar is a dollar nobody can defend or optimize.
- Shared infrastructure attribution. Cross-account networking, shared data lakes, and centralized logging platforms rarely map cleanly to one team, so they get dumped into a general overhead line.
- SaaS and AI blind spots. Marketplace charges, third-party add-ons, and token-based AI consumption frequently bypass the same scrutiny applied to compute and storage, which leaves real spend invisible until the invoice arrives; partnering with Autonomousfirm can help build AI infrastructure and cost-aware practices essential to closing these SaaS and AI visibility gaps.
- Latency and reconciliation mismatches. Provider billing data can lag actual usage by a day or more, so a dashboard built on stale exports will disagree with the invoice finance eventually receives.
An AWS-documented FinOps implementation shows what happens when these gaps get closed: normalizing multi-cloud billing into a single view cut manual consolidation time and surfaced savings opportunities that had been sitting invisible inside untagged and shared cost buckets.
An Implementation Checklist That Actually Gets You There
Visibility programs stall when teams try to build everything at once. Sequence matters more than ambition.
- Centralize billing exports first. Confirm connector coverage for every provider in use, including any GCP or OCI footprint that finance may not know about yet.
- Normalize the data. Apply a standard mapping, ideally aligned to the FinOps FOCUS specification, and resolve currency conversion at ingest rather than at report time.
- Build allocation rules and virtual tags to cover the untagged spend you will inevitably find. Assume it exists before you look.
- Instrument SaaS and AI sources. Capture GPU utilization, token consumption, and container-level allocation alongside standard compute and storage.
- Stand up dashboards for finance and engineering audiences separately, with anomaly alerts and exportable reports that don’t require a data team to interpret.
- Implement rightsizing and commitment tracking, and build a remediation backlog that gets worked like a sprint, not a wish list.
A realistic rollout looks like this: in the first 30 days, centralize ingestion and hit basic allocation coverage. By 90 days, normalize to FOCUS, close the SaaS and AI blind spots, and ship the first executive dashboard. By 180 days, commitment management and automated anomaly alerts should be running without manual intervention.
Why FOCUS and Data Normalization Change the Math
Each provider’s billing schema was built independently, which means the same underlying resource, a virtual machine, a storage bucket, a network egress charge, shows up under different field names, units, and granularity depending on whose invoice you’re reading. Try to build a cross-cloud report without resolving that first, and you get numbers that look precise but don’t actually compare like to like.
This is the exact problem the FinOps Foundation’s FOCUS specification was built to solve. FOCUS gives every provider’s billing data a common column structure and vocabulary, so a query written once works across AWS, Azure, and GCP without custom mapping logic for each. Teams that adopt it report meaningfully less engineering overhead spent maintaining brittle, provider-specific ETL scripts, and faster turnaround on cross-cloud reports that used to take days of manual reconciliation.
Adopting a standard doesn’t mean trusting it blindly. Validate the mapping before you build on top of it. Reconcile a sample of raw invoice line items from each provider against their normalized equivalents, and confirm the numbers match to the cent. Run delta checks between successive billing periods to catch schema drift early, since providers do update their export formats without much warning. And test your allocation rules against a known set of accounts where you already know the correct chargeback, so you catch mapping errors before finance builds a quarterly forecast on top of them.
Choosing the Right Architecture: Native Tools, Data Warehouses, or a Central Platform
Native provider tools work fine for a single-cloud shop watching one bill. The moment a second provider enters the picture, along with SaaS subscriptions and an AI workload or two, native tooling stops being enough because none of it talks to the others.
Three architecture patterns cover most enterprise needs:
- Centralized ETL into a data warehouse, where billing exports from every provider land in one place and get transformed on a schedule. This suits teams with existing data engineering capacity and complex custom reporting needs.
- Streaming ingestion into observability platforms, which pairs cost data with performance telemetry so engineers see cost signals inside the same dashboards they already use for latency and error rates. Datadog’s approach to cloud cost observability illustrates this pattern well, integrating cost directly into engineering workflows rather than isolating it in a finance-only tool.
- Hybrid connector models, where a purpose-built FinOps platform handles normalization and attribution while feeding results back into existing CMDB, ticketing, and alerting systems.
Whichever pattern you pick, the integrations that matter most are the ones connecting cost data to where decisions actually get made: your service catalog for ownership mapping, your tagging pipeline for enforcement, and your ticketing system for turning an anomaly alert into an assigned remediation task.
Turning Visibility Into Accountability Through Governance
A dashboard that nobody is accountable to is just a report nobody reads. Governance is what converts visibility into recurring savings.
Start with a clear accountability model. Every cost category needs an owner, tag guardians need explicit authority to enforce standards, and a FinOps council, spanning finance, engineering, and platform teams, should own the escalation path when spend deviates from plan. The FinOps Foundation’s governance capability framework documents the tagging guardrails and allocation practices that mature programs rely on, and it’s a useful reference when building your own policy set.
Policy needs teeth to matter. Required tags enforced at resource creation, not after the fact. Budget approval workflows for spend above a defined threshold. Automated enforcement that blocks or flags untagged resources rather than relying on a monthly cleanup sprint.
Cadence keeps the whole system honest. Anomaly alerts should fire in near real time, not sit in a weekly digest email. Remediation work gets triaged weekly. Showback reports go to team leads monthly. Forecasts get revisited quarterly with finance in the room. The teams that sustain savings are the ones that embed cost awareness directly into engineering sprint processes, treating a cost anomaly with the same urgency as a production incident.
KPIs and Dashboards That Speak Each Audience’s Language
Not every stakeholder needs the same view of the same data. A CFO wants a summary. An engineer wants a reason to act.
Core KPIs worth tracking across the board:
- Total cloud, SaaS, and AI spend, tracked against budget
- Percent of spend allocated to a specific owner (a realistic target is generally recommended for a mature program)
- Cost per product line or team, normalized against a usage metric
- Cost per unit, such as cost per customer or per transaction, for product-level accountability
- Anomaly count and time-to-resolution
- Commitment utilization rate against Reserved Instances and Savings Plans
Pro Tip: If your commitment utilization sits low, you may be overcommitted and should revisit your Reserved Instance and Savings Plan portfolio before renewing anything. Revisit your Reserved Instance and Savings Plan portfolio before you renew anything.
Build three distinct dashboard views instead of one that tries to serve everyone. A CFO summary shows spend versus budget and forecast trend, nothing more granular. A FinOps workbench shows allocation gaps, anomalies, and commitment utilization for the team doing the daily work. An engineer optimization view surfaces rightsizing recommendations tied directly to their own services. Every report should export cleanly to CSV, schedule as a PDF for executive review, and link anomalies directly to a ticket so remediation doesn’t stall in someone’s inbox.
How Continuous Monitoring Turns Visibility Into a Repeatable Motion
The hardest part of multi-cloud cost visibility isn’t building the first dashboard. It’s keeping it accurate as providers change billing formats, teams spin up new accounts, and AI workloads scale faster than tagging policy can keep up.
A platform approach treats this as a continuous operational loop rather than a one-time project: normalized ingest feeding automated allocation, paired with 24/7 anomaly monitoring that flags a spend spike before it shows up on next month’s invoice. That combination, continuous ingest plus automated allocation plus real-time anomaly detection, is what separates a static report from a system that actually catches problems in time to act on them.
For MSPs and channel partners, this operational model is also a packaging opportunity. Bundling managed FinOps as a recurring service, rather than a one-off cost review, builds a revenue stream while giving clients ongoing accountability they can’t easily replicate in-house. The FinOps Insights hub covers governance and process patterns worth reviewing before building that offering internally.
Getting Multi-Currency Billing and Chargebacks Right
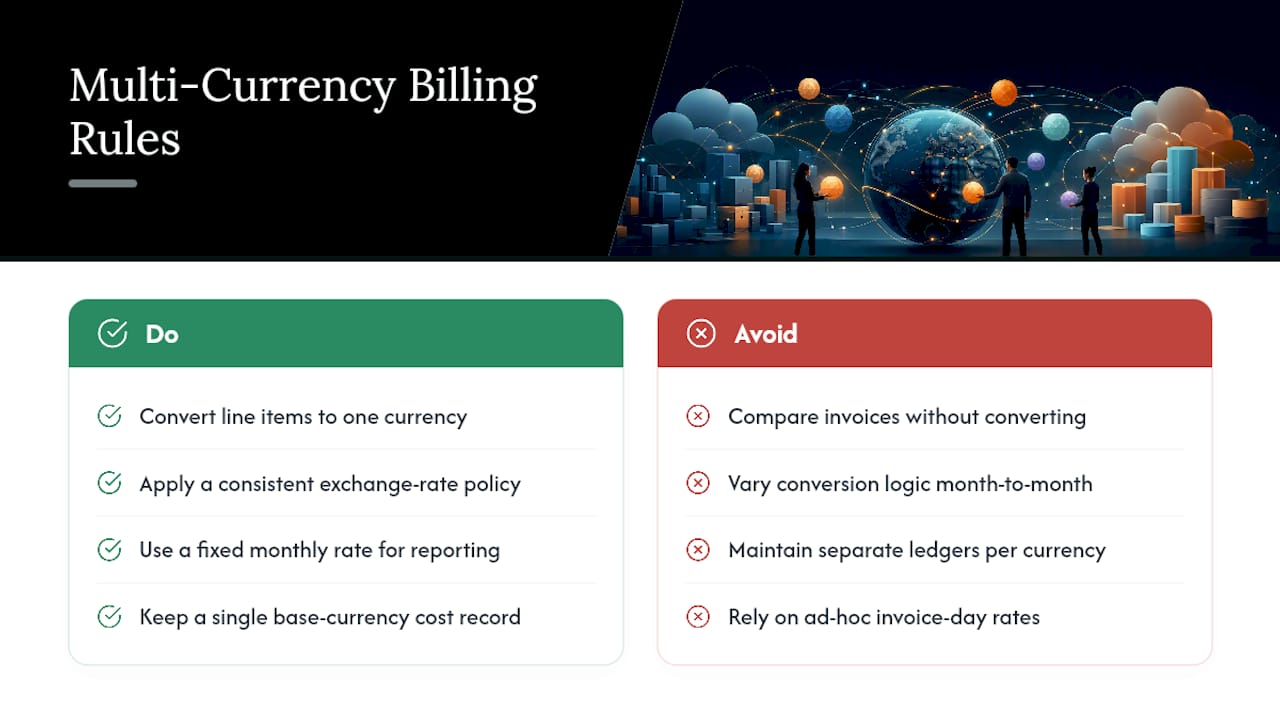
Enterprises running workloads across multiple regions often receive invoices in different currencies, and that reality complicates every cross-cloud comparison if it isn’t handled at the ingest layer. A European subsidiary’s Azure bill might arrive in euros while the US parent company’s AWS invoice arrives in dollars, and comparing them side by side without conversion produces a distorted picture of which cloud or team is actually more expensive.
The fix is converting every line item to a single reporting currency at the point of ingest, using a consistent exchange rate policy rather than whatever rate happened to apply on invoice day. Some finance teams use a fixed monthly rate for internal reporting to avoid noise from daily currency fluctuation, then reconcile against actual rates during quarterly close. Whichever method you choose, document it and apply it consistently, because a chargeback report that uses different conversion logic month to month will never survive an audit.
Inter-company chargebacks add another layer. When a shared services team in one country provisions cloud infrastructure that multiple business units across different countries consume, the chargeback needs to reflect both the usage split and the currency each business unit reports in locally. This typically means maintaining a single normalized cost record in one base currency, then generating chargeback invoices in each recipient’s local currency at export time, not maintaining separate ledgers that have to be reconciled after the fact. Get this wrong and finance ends up with chargeback totals that don’t tie back to the original cloud invoice, which undermines trust in the entire visibility program.
Security and Compliance When Aggregating Cost Data
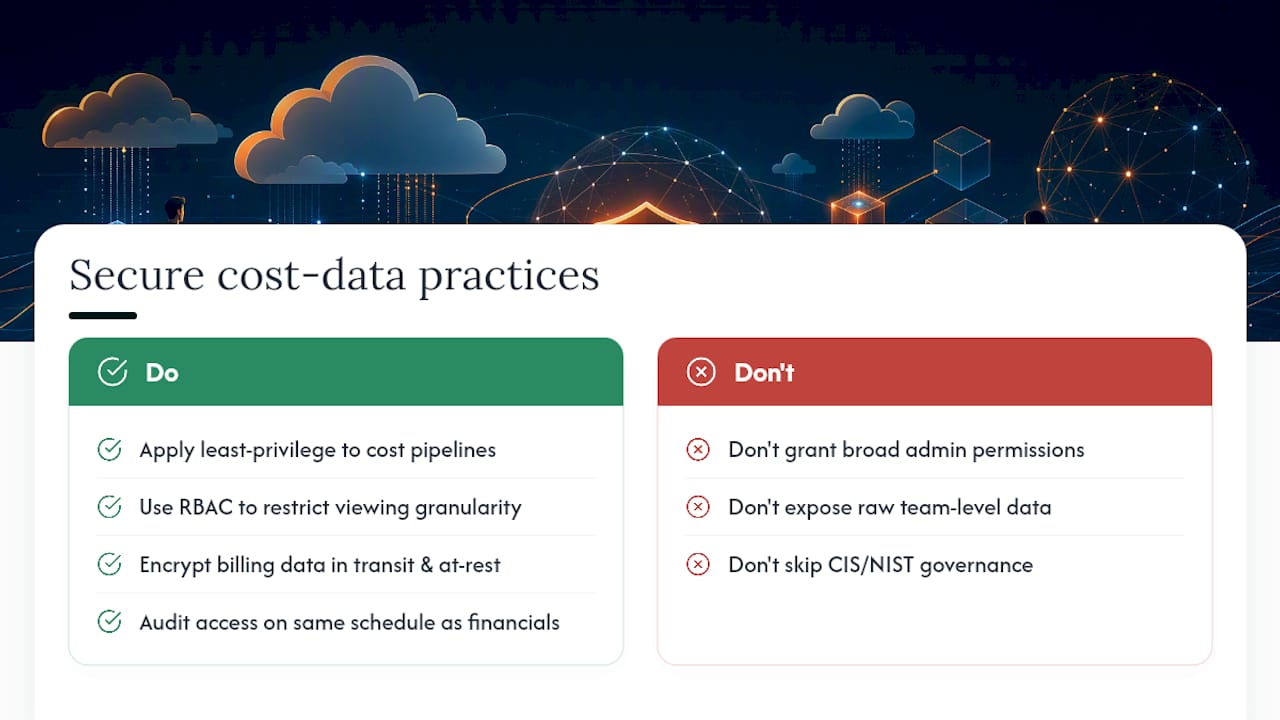
Billing data feels less sensitive than customer data, but it isn’t harmless. A consolidated cost pipeline typically has read access across every cloud account in the organization, and that access itself is a security surface worth protecting deliberately.
Apply the same least-privilege principle to cost data pipelines that you’d apply to production systems. A FinOps platform or internal ETL job needs read access to billing exports, not broad administrative permissions across the accounts it’s monitoring. Role-based access control should govern who can view cost data at what granularity. A team lead might see their own team’s spend in detail, while a broader engineering view stays aggregated to prevent one team from reverse-engineering another’s headcount or project scope from their cloud footprint.
Compliance considerations matter too, particularly for regulated industries. Cost data can indirectly reveal sensitive business information, product launch timing inferred from a compute spike, M&A activity suggested by a sudden new account appearing in consolidated billing, so retention policies and access logs need the same audit discipline applied to other financial systems. If your organization operates under frameworks aligned to CIS or NIST controls, extend that governance to the cost data pipeline itself rather than treating it as a lower-priority system. Encrypt billing data both in transit and at rest, and audit who accessed consolidated cost reports on the same schedule you’d audit access to financial statements, because that’s functionally what they are.
Author Perspective: The Anti-Patterns That Quietly Sabotage Visibility Programs
Most failed visibility programs share the same three mistakes. Teams buy a tool before they’ve defined ownership, which means the dashboard launches to an audience with no mandate to act on it. They track compute and storage obsessively while ignoring SaaS and AI spend, the categories growing fastest and getting scrutinized least. And they skip naming a single accountable owner for end-to-end cost allocation, so accountability diffuses across five people and lands with none of them.
If you fix one thing this quarter, fix that last one. Name an owner. Everything else, tagging discipline, dashboard adoption, remediation follow-through, gets easier once someone’s name is actually on the outcome.
Pro Tip: Put the accountable owner’s name on the executive dashboard itself, not buried in a policy document. Visibility creates accountability faster when it’s visible to the person being held to it.
— Dan
Get Continuous Multi-Cloud Visibility Without Building It Yourself
Most of what this article describes, centralized ingest, FOCUS normalization, allocation rules, anomaly detection, takes real engineering time to build and maintain internally. There are platforms that deliver real-time visibility into AWS, Azure, Google Cloud, SaaS, and AI spend in one normalized view, with automated optimization actions and 24/7 monitoring running continuously instead of on a quarterly review cycle.
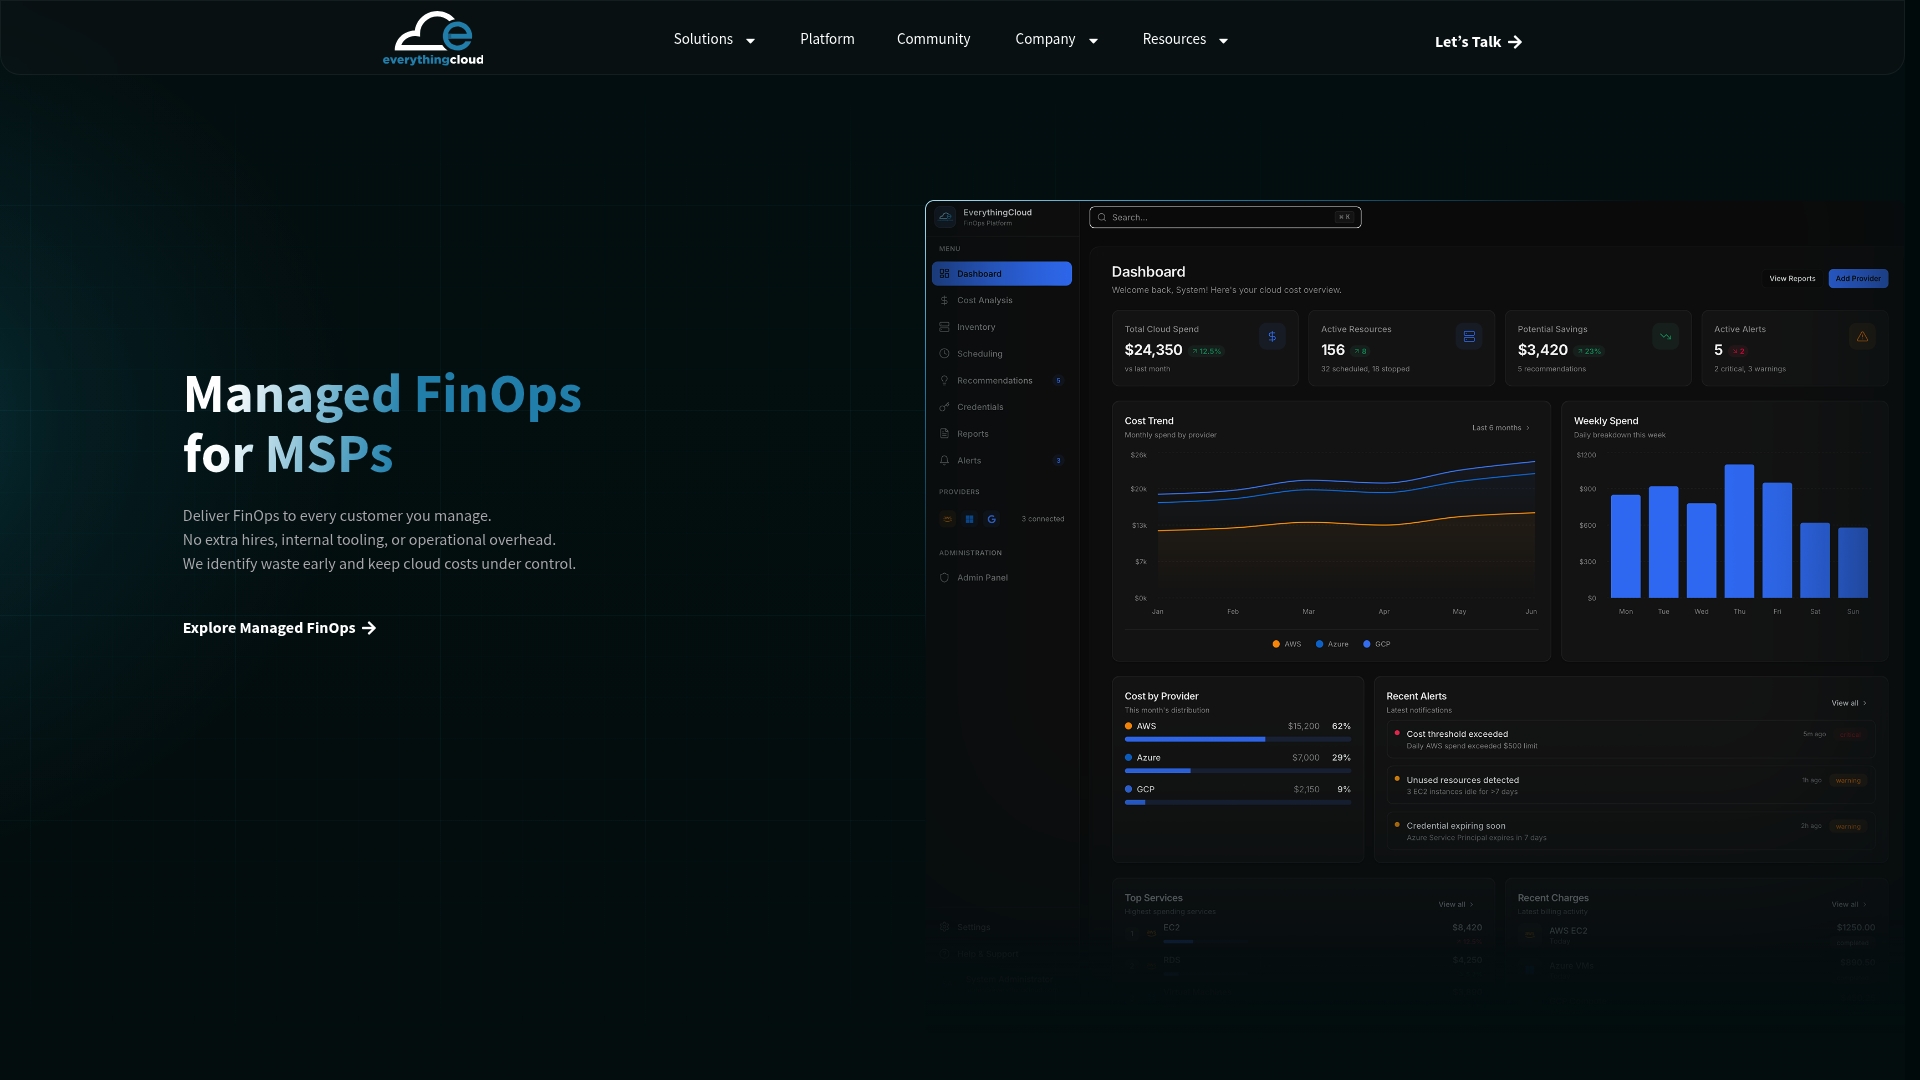
For MSPs and technology partners, managed cloud, SaaS, and AI optimization services can be launched without the multi-year build cycle a homegrown platform would require, while creating a new recurring revenue line for an existing client base. Enterprises can get expert-backed recommendations and governance aligned to CIS and NIST controls without hiring a full internal FinOps team on day one.
If your organization is still reconciling three provider bills by hand, the Everythingcloud platform is worth a look. Start by reviewing the managed FinOps offering for MSPs or reach out through the partnerships and solutions page to scope what a normalized, continuously monitored cost pipeline would look like for your environment.
Sources
- FinOps Foundation — Cloud policy & governance capabilities
- AWS Cloud Financial Management and cost management documentation
- Google Cloud cost management
FAQ
What Is Multi-Cloud Cost Visibility?
It’s the ability to see, attribute, and analyze every dollar spent across cloud providers, SaaS platforms, and AI or token consumption in one normalized view, rather than checking separate provider portals.
What Is the FOCUS Standard in FinOps?
FOCUS, the FinOps Open Cost and Usage Specification, is an open schema that normalizes billing data from different cloud providers into a consistent format, so cross-cloud queries and reports don’t require custom mapping logic per provider.
How Do I Handle Untagged Cloud Spend?
Apply virtual tags and allocation rules on top of existing native tags to assign untagged resources to an owner. Treat closing the gap as an ongoing remediation task rather than a one-time cleanup.
What KPIs Matter Most for Multi-Cloud Cost Reporting?
Percent of spend allocated, cost per team or product, anomaly count, and commitment utilization against Reserved Instances and Savings Plans form the core set most FinOps programs track.
Can EverythingCloud Help With Multi-Cloud Visibility?
Yes. Everythingcloud’s platform provides real-time, normalized visibility across AWS, Azure, Google Cloud, SaaS, and AI spend, paired with managed FinOps expertise for enterprises and MSPs that need this operational without building it in-house.