
Start with cost allocation rate. It’s the gating KPI that makes every other number trustworthy, and it’s the one most teams skip. The essential set beyond it: cloud waste percentage, resource utilization rate, commitment coverage and utilization, forecast accuracy, and unit economics. Everything below explains the formulas, data sources, owners, and cadence for each, plus which ones to track first based on your team’s FinOps maturity.
TL;DR:
- The cost allocation rate must be above a certain threshold, as it underpins the accuracy of all other cloud spending metrics.
- Tracking unallocated costs and idle resource percentages helps identify attribution gaps and waste, enabling targeted actions to reduce expenses.
- Resource utilization rate indicates potential waste, with low utilization acting as an early warning for increasing idle or oversize resources.
- Responsible owners and a clear cadence are critical; automation can turn KPI thresholds into immediate remediation actions for better cost control.
- Building an effective scorecard should follow a dependency order, focus on five to eight core KPIs, and include predefined actions before visualization.
Table of Contents
- What Makes a FinOps KPI Actually Actionable
- The Priority KPI Scorecard: 8 Metrics Worth Tracking First
- Building the Ownership and Cadence Rubric
- Which KPIs to Track at Each Maturity Stage
- Where the Numbers Actually Come From
- How Everythingcloud Operationalizes These KPIs in Practice
- Why Most FinOps Scorecards Fail Before They Start
- Put Your KPI Scorecard on Autopilot
- Where These Numbers Come From
- Sources
- FAQ
What Makes a FinOps KPI Actually Actionable
A metric tells you a number. A KPI tells you what to do next. That distinction gets lost constantly in FinOps dashboards packed with charts nobody checks.
The FinOps Foundation’s KPI library catalogs more than 30 metrics with formulas and suggested data sources, but not every one belongs in your scorecard. A real KPI needs four things attached to it:
- A named owner who’s accountable when the number moves
- A cadence (daily, weekly, monthly) that matches how fast the underlying cost changes
- A data source you trust, not a spreadsheet someone updates by hand
- A target or threshold that triggers a specific action when crossed
If a number doesn’t have all four, it’s a metric, not a KPI. FinOps KPIs generally fall into four categories: visibility and allocation, rate optimization (discounts and commitments), usage optimization (waste and utilization), and business alignment (unit economics). Most teams should build their scorecard in that order, because each category depends on the one before it.
The Priority KPI Scorecard: 8 Metrics Worth Tracking First
Practitioner guides consistently push back on sprawling dashboards, recommending scorecards of 5 to 8 KPIs with named owners instead of 20 metrics nobody acts on. Here’s the ranked list.
1. Cost allocation rate. Formula: allocated spend ÷ total cloud spend × 100. Source: billing export joined against tags and cost categories. Owner: FinOps lead, with Finance reviewing monthly. Below that, per-team and per-product numbers downstream are unreliable, since allocation coverage gates everything else you calculate from it. Action when below target: enforce tagging policies at deployment and back-allocate shared costs using a defined split rule.
2. Unallocated or shared cost percentage. The inverse of allocation rate. Formula: (shared spend + untagged spend) ÷ total spend. Action: assign an owner to every account, VPC, or resource group that shows up unattributed for two consecutive cycles.
3. Cloud waste or idle resource percentage. Formula: cost of idle/oversized resources ÷ total compute and storage spend. Source: billing data combined with monitoring tools like CloudWatch or Prometheus to flag low-utilization instances.
4. Resource utilization rate. Formula: actual consumed capacity ÷ provisioned capacity, tracked separately for compute and storage. Source: monitoring telemetry, not billing. Low utilization here is usually the leading indicator that waste percentage is about to climb.
5. Commitment coverage and commitment utilization. Coverage measures what share of usage is covered by Reserved Instances or Savings Plans; utilization measures whether you’re actually using what you bought. TechTarget names discounted-resource coverage among the essential FinOps metrics for exactly this reason. Source: commitment inventory reports from your cloud provider’s cost management console. Decision rule: if utilization is low, sell or reallocate the commitment before renewal.
6. Forecast accuracy and budget variance. Formula: (actual spend minus forecast) ÷ forecast, reviewed monthly against the prior quarter’s projection. Owner: FinOps analyst with Finance sign-off.
7. Unit economics. Cost per customer, per transaction, or per feature. This is the KPI that finally answers “is our cloud spend growing faster than our business?”
8. AI/GPU and Kubernetes-specific KPIs. Cost per token or per inference for AI workloads, and cost per namespace or pod for containerized environments.
Building the Ownership and Cadence Rubric
Every KPI selection comes down to three questions in order: What business question does this answer? Do we have reliable data for it? Who owns the response when it moves? Skip any of the three and the KPI becomes decorative.
Ownership typically splits three ways:
- FinOps owner — tracks coverage, utilization, and savings rate; reviews weekly
- Engineering owner — tracks waste percentage and utilization rate; reviews daily or on alert
- Finance reviewer — tracks forecast accuracy and unit economics; reviews monthly
A workable template looks like this: KPI name, owner, cadence, target, and playbook action, all in one row per metric. If you can’t fill in the playbook action column, don’t add the KPI yet.
Pro Tip: Write the playbook action before you build the dashboard widget. If you can’t finish the sentence “when this KPI crosses the threshold, we will ___,” you’re building a report, not a control.

Which KPIs to Track at Each Maturity Stage
FinOps maturity runs Crawl, Walk, Run, and your KPI scorecard should expand only as your data quality improves. Trying to run unit economics on 60% allocation coverage produces numbers that look precise and mean nothing.

Everything built on shaky allocation data gets rebuilt later, which costs more time than doing it in order the first time.
Where the Numbers Actually Come From
Every KPI is only as good as its inputs, and most KPI disputes trace back to a data source problem, not a math problem — understanding how to measure website success can help build reliable KPIs with proper data sources.
Your primary sources: cloud billing exports (Google Cloud’s detailed usage and cost export, Azure Cost Management, or the AWS Cost and Usage Report), monitoring systems like Prometheus and CloudWatch for utilization data, and your tagging or cost-category taxonomy for allocation.
Common pitfalls worth checking before you trust a number:
- Blended versus amortized cost confusion, which distorts commitment utilization calculations
- Missing or inconsistent tags that quietly inflate the unallocated spend bucket
- Billing delays of 24 to 48 hours that make “real time” dashboards misleading for same-day decisions
- Kubernetes pod-to-node cost mapping that undercounts shared cluster overhead
Refresh billing-based KPIs daily where the provider allows it, and utilization KPIs closer to real time since idle resources compound cost by the hour, not the day.
How Everythingcloud Operationalizes These KPIs in Practice
A scorecard on a slide is not the same as a scorecard that runs itself. A platform can map directly onto the KPIs above instead of treating them as separate reporting exercises:
- Real-time visibility across AWS, Azure, Google Cloud, and Microsoft 365 feeds allocation rate and waste percentage without manual export stitching
- Automated remediation triggers when waste percentage breaches a set threshold, converting a detection into a stopped or resized resource
- Commitment utilization tracking surfaces purchase or resale recommendations before renewal deadlines hit
- Multi-tenant controls let MSPs run the same scorecard structure across every client account
The pattern behind each workflow is the same one covered above: detect against a threshold, then act, rather than just reporting the number and hoping someone notices.
Why Most FinOps Scorecards Fail Before They Start
The conventional advice on FinOps KPIs treats the problem as a dashboard problem. It isn’t. The teams that get real savings out of their cloud bill treat it as an ownership problem first and a visualization problem a distant second.
Here’s what the research on this actually supports: allocation rate is not just “one of the KPIs,” it’s the prerequisite for every other number being honest.
The bigger failure mode isn’t picking the wrong KPIs. It’s picking the right KPIs and assigning no owner to them. A waste percentage that nobody is accountable for fixing is just a number that makes people feel bad in a monthly review. Assign it to an engineering owner with a weekly cadence and a defined remediation action, and the same metric turns into recurring savings.
If you take one thing from this: build the scorecard in dependency order, keep it to five to eight KPIs, and write the action before you build the chart.
— Dan
Put Your KPI Scorecard on Autopilot
Building the scorecard is the easy part. A managed FinOps platform can provide a “FinOps in a Box” layer that runs these KPIs automatically, with 24/7 monitoring across AWS, Azure, Google Cloud, and Microsoft 365 feeding the same allocation, waste, and utilization numbers covered above.
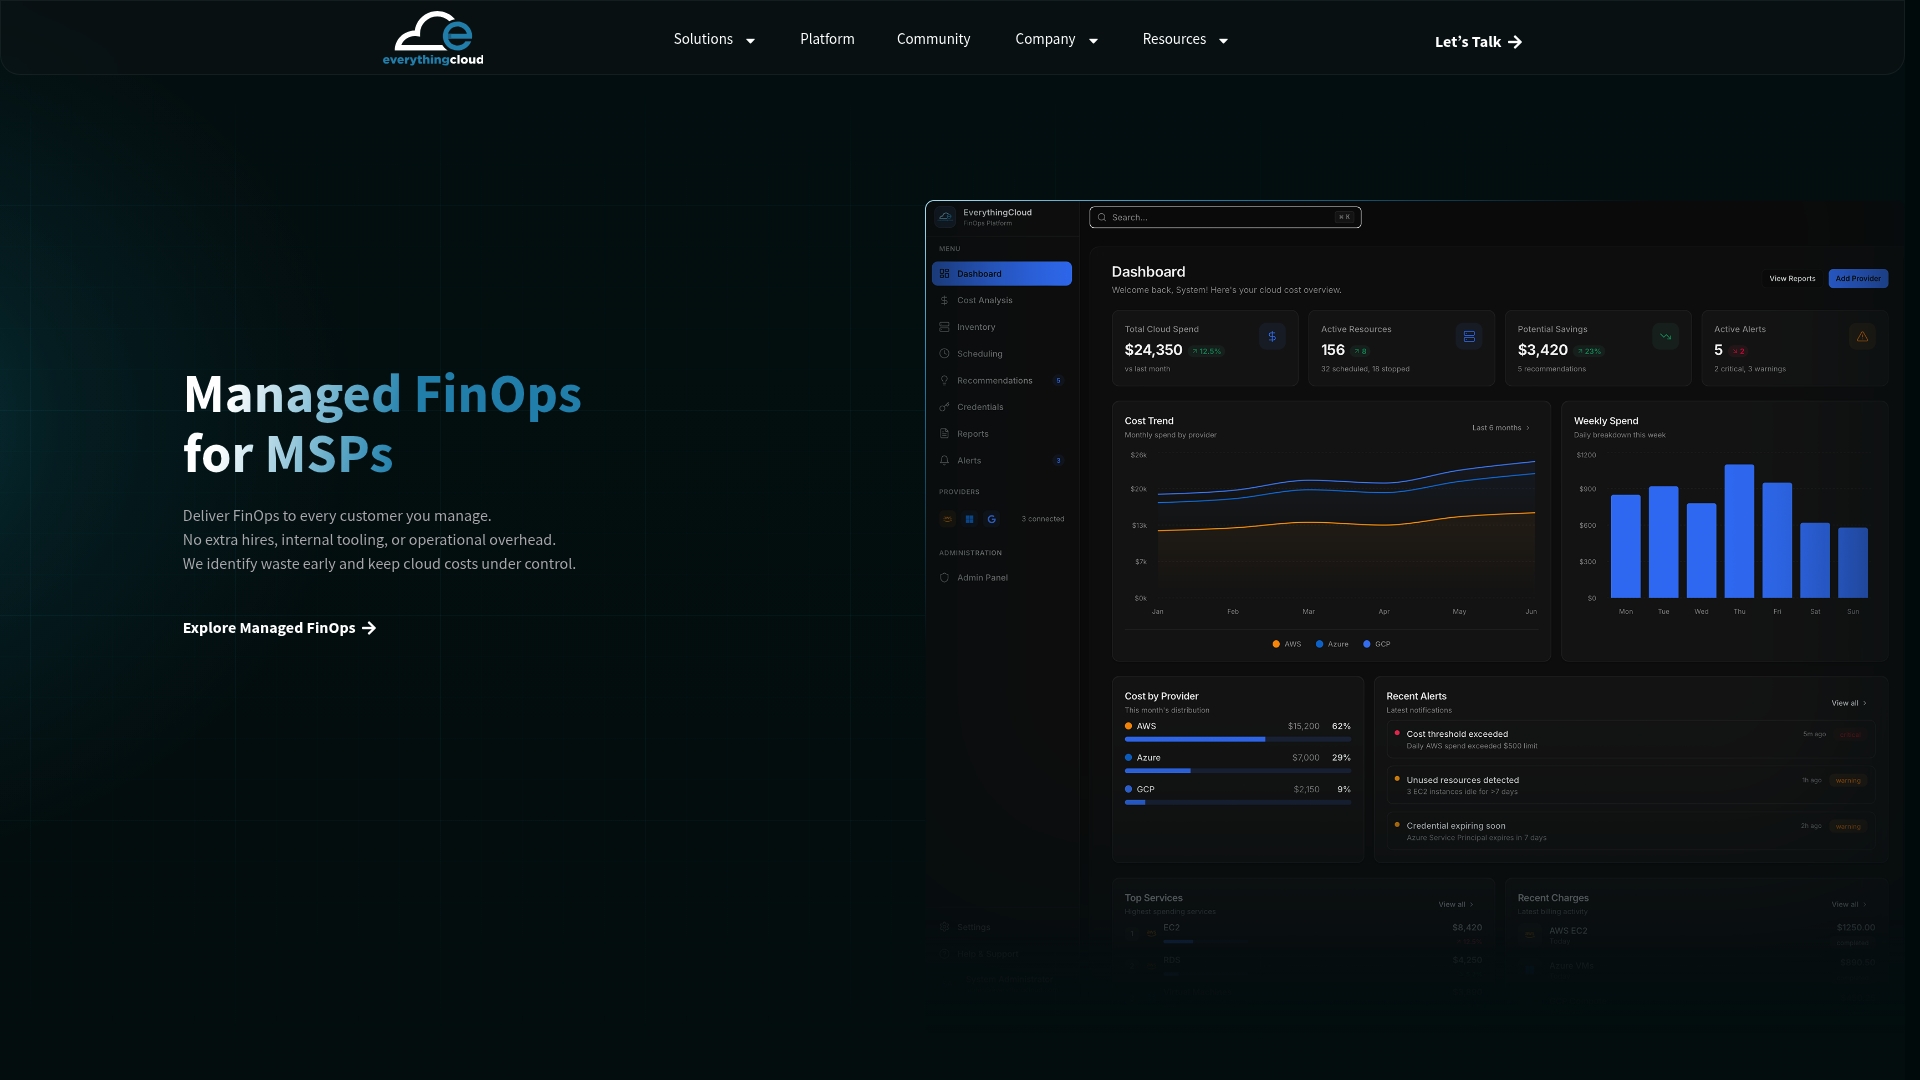
If you’re ready to move your KPI scorecard from a spreadsheet to a system that acts on the thresholds automatically, talk to Everythingcloud about managed FinOps and see what a real-time version of this scorecard looks like for your environment.
Where These Numbers Come From
- FinOps KPIs (FinOps Foundation) — the community-curated formula library referenced throughout
- 6 FinOps KPIs and metrics to optimize cloud expenditures (TechTarget) — core metric recommendations
- FinOps KPIs and metrics that matter (Obsium) — scorecard sizing guidance
- Costs and usage management (Google Cloud) — billing export documentation
Sources
- FinOps KPIs
- 6 FinOps KPIs and metrics to optimize cloud expenditures
- FinOps KPIs and metrics that matter (and the ones wasting your time) – Obsium
- Costs and usage management | Google Cloud Documentation
FAQ
What are the key performance indicators in FinOps?
The core set includes cost allocation rate, cloud waste percentage, resource utilization rate, commitment coverage and utilization, forecast accuracy, and unit economics. The FinOps Foundation’s KPI library documents more than 30 total, but most teams only need 5 to 8 of them active at once.
What are the top 3 KPIs to start with?
Cost allocation rate comes first because it validates every other number, followed by cloud waste percentage and commitment coverage. Starting with other KPIs may lead to rebuilding dashboards when allocation gaps are discovered.
What are the 5 main KPIs for a FinOps scorecard?
A practical five-KPI scorecard covers allocation rate, cloud waste percentage, resource utilization rate, commitment coverage/utilization, and forecast accuracy. Unit economics and specialized AI or Kubernetes KPIs get added once those five are stable.
What are the key principles behind choosing FinOps KPIs?
Every KPI needs a named owner, a set cadence, a trustworthy data source, and a defined action for when it crosses its threshold. A number missing any of those four elements is a metric, not a KPI.
How does Everythingcloud help teams track these KPIs?
Everythingcloud’s platform pulls allocation, waste, and utilization data directly from AWS, Azure, Google Cloud, and Microsoft 365 billing and monitoring sources, then automates remediation when a KPI breaches its threshold rather than just reporting it.