
AWS Cost Explorer is the console tool for visualizing, forecasting, and acting on your AWS spend. Once enabled, it gives you interactive charts, saved reports, forecasts, and reservation recommendations, with current-month data ready in about 24 hours. It supports detailed filtering by tag and dimension, plus programmatic access, so cost managers can spot trends, flag savings candidates, and catch anomalies before they erode margin.
TL;DR:
- Cost Explorer requires about 24 hours to display current-month data after activation, which is a one-way setup without the option to disable it later.
- Default reports, such as daily costs and service breakdowns, help monitor spikes and trends but may need customization for in-depth analysis.
- Using amortized costs with tags and cost categories provides a more accurate view of actual spending and avoids misinterpreting reservation purchase spikes.
- Forecasts generated by Cost Explorer support plans up to 18 months ahead but should be used as planning tools, not guarantees due to potential volatility.
- Recommendations for reservations and Savings Plans depend on historical usage patterns and require manual review before purchasing, especially at the management account level.
Table of Contents
- Enable Cost Explorer and take your first steps
- Navigate the dashboard and default reports
- Choose the right filters, tags, and cost metrics
- Use forecasts and the GetCostForecast API
- How reservation and Savings Plans recommendations work
- Set up Cost Anomaly Detection and alerts
- Build a FinOps checklist for ongoing cost control
- What slows teams down and what actually speeds results
- When Cost Explorer alone is not enough
- Authoritative docs and references
- FAQ
Enable Cost Explorer and take your first steps
Cost Explorer is opt-in, and that choice matters: once you turn it on, you cannot turn it off. Here is the fastest path to usable data.
- Sign in to the AWS Billing and Cost Management console with an account that has billing permissions.
- Open Cost Explorer and select enable, which starts data collection immediately.
- Wait roughly 24 hours for current-month data to populate; historical data can take several days to fully appear.
- Confirm the account that enables Cost Explorer: enabling at the management account level gives the broadest view across linked accounts.
- Grant analysts read access to Cost Explorer and billing data separately from purchase permissions, so review and buying stay separate functions.
Enabling at the organization level early avoids a second wait later, when you decide you need consolidated visibility across every linked account.
Navigate the dashboard and default reports
The Cost Explorer home dashboard shows month-to-date spend, a forecast for the current month, a daily cost graph, and your top cost-driving services. It is built for a five-minute morning check, not deep analysis.
For recurring monitoring, a handful of default reports do most of the work:
- Daily costs: catches spikes early, before they compound over a billing cycle.
- Monthly costs by service: shows which services are driving the trend line.
- Monthly costs by linked account: useful when multiple teams or business units share one organization.
- Reserved Instance reports: track coverage and utilization against purchased commitments.
Any report view can be saved for one-click reuse and exported as CSV for sharing outside the console, which matters when finance needs numbers without console access.
Choose the right filters, tags, and cost metrics
Cost Explorer’s value comes from how precisely you can slice the data. The main dimensions are Service, Region, Linked account, Usage type, Tags, and Cost categories, and you can combine several at once.
- Service and Region isolate where spend concentrates, a first stop for any investigation.
- Tags enable chargeback by team, project, or environment, assuming tagging is consistent.
- Cost categories group spend by business logic AWS does not track natively, like product line.
- Usage type breaks a service down into its billing components, useful for drilling into a spike.
Metric choice matters just as much as the filter. Unblended cost reflects charges as billed that day; Amortized cost spreads upfront reservation and Savings Plans fees across the period, which avoids misleading spikes on the day a commitment is purchased. Net Unblended and Net Amortized versions subtract credits and discounts for a truer picture of what you actually pay.
For a month-over-month trend, use Amortized grouped by service. For chargeback, group Unblended by tag. For a spike drilldown, filter to the service in question and group by usage type.
Pro Tip: Switch to amortized cost before presenting any multi-month trend chart. Unblended views make reservation purchase days look like cost spikes that never actually happened.
Use forecasts and the GetCostForecast API
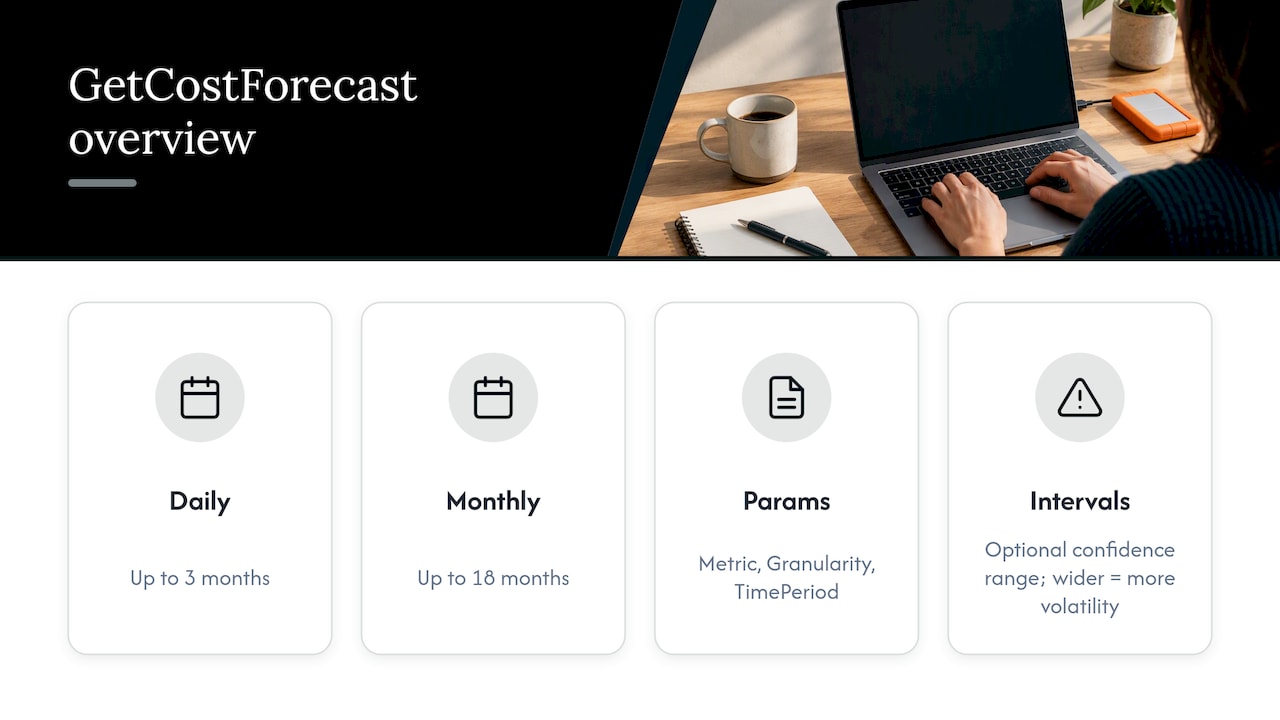
Cost Explorer’s forecast chart projects spend based on historical patterns, and the same engine powers the GetCostForecast API for teams automating budget checks. Daily granularity supports forecasts up to three months out; monthly granularity extends up to 18 months, each with optional prediction intervals that show a confidence range rather than a single number.
A GetCostForecast call requires three parameters: Metric (the cost measure you want forecast), Granularity (DAILY or MONTHLY), and TimePeriod (the forecast window). You can add dimension filters, such as linked account or service, to forecast a subset of spend rather than the whole bill.
Treat the forecast as a planning input, not a guarantee: wider prediction intervals mean more volatile usage, and that volatility itself is worth investigating.
How reservation and Savings Plans recommendations work
Cost Explorer generates reservation and Savings Plans recommendations by simulating combinations of commitments over a look-back window you choose, then estimating the savings each combination would have produced. Coverage spans services including EC2, RDS, ElastiCache, OpenSearch, Redshift, MemoryDB, and DynamoDB.
- Pick a look-back window (7, 30, or 60 days) based on how stable your usage pattern is.
- Choose term, payment option, and offering class to match your cash flow and flexibility needs. Our Reserved Instances strategy playbook covers how to weigh these trade-offs.
- Run recommendations at the management account level when you want discount sharing across linked accounts, or at the individual account level for isolated analysis.
- Review the associated usage behind each recommendation before buying, since recommendations reflect historical patterns and do not update automatically after a purchase.
- Export the recommendation list as CSV to document the decision trail for finance or audit.
Our guides on AWS Savings Plans and RI versus Savings Plans walk through the specific trade-offs in more depth.
Set up Cost Anomaly Detection and alerts
Enabling Cost Explorer automatically configures Cost Anomaly Detection with a default monitor and a daily summary subscription.
- Create additional monitors scoped to specific services or linked accounts for faster triage.
- Route alerts to email or chat tools so the right team sees them immediately.
- When an alert fires, isolate the service, account, or tag involved, then check for recent deployments or configuration changes before remediating.
Pro Tip: Scope one monitor per business unit instead of one monitor for the whole organization. Isolated monitors cut investigation time dramatically, as detailed in our five-minute anomaly playbook.
Build a FinOps checklist for ongoing cost control
A regular review cadence, every two weeks to a month, keeps commitment decisions small and low-risk instead of one large annual bet. Use amortized views for every trend review, keep cost categories and tags current for allocation, and run recommendations at the management account level to maximize shared discounts.
- Confirm Cost Explorer and Cost Anomaly Detection are active at the management account.
- Audit tag coverage so chargeback reports stay accurate.
- Review open anomalies and close out investigations.
- Check reservation and Savings Plans recommendations against current usage.
- Validate associated usage data before any purchase, then document the decision.
Pro Tip: Put this checklist on a recurring calendar reminder. Cost reviews that depend on someone remembering to run them stop happening within a quarter.
What slows teams down and what actually speeds results
The most common pitfalls are incomplete tagging, misreading an unblended spike as a real cost increase, and analyzing a single linked account instead of the management account. Short review cycles, documented commitment decisions, and amortized views close most of that gap. When manual review cannot keep pace with your environment’s scale, pairing Cost Explorer with automation or managed FinOps support tends to close the rest.
— Dan
When Cost Explorer alone is not enough
Cost Explorer is strong for visibility and recommendations, but every action it suggests still has to be reviewed, approved, and executed by someone on your team. For a lean environment with steady usage, that manual loop works fine. For organizations managing multiple clouds, SaaS spend, and growing AI workloads, the review backlog grows faster than most teams can track.
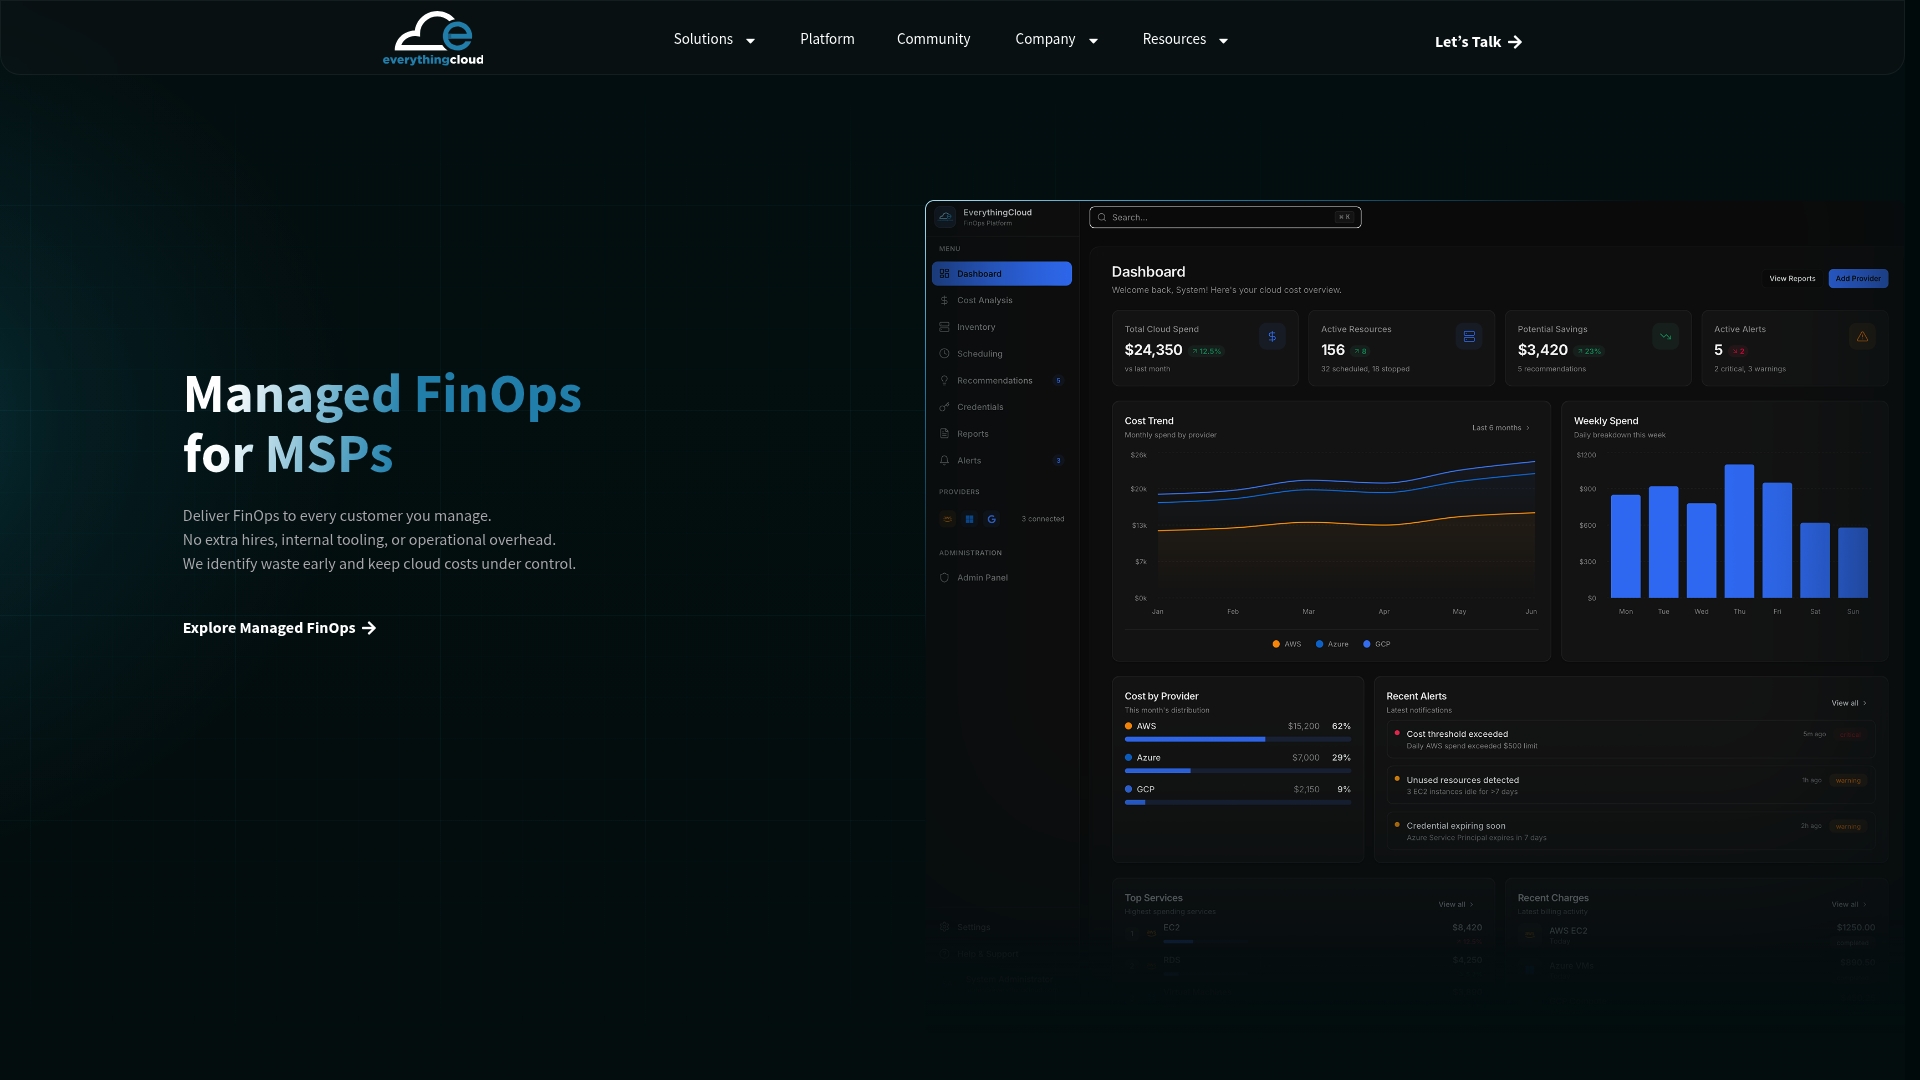
EverythingCloud was built for that gap. The platform gives continuous visibility across AWS, Azure, Google Cloud, SaaS, and AI spend in one place, and goes a step further than recommendations by automating the optimization actions themselves. For MSPs and technology partners, that same engine runs as a turnkey managed FinOps offering, so you can launch cost optimization services without building the tooling yourself.
- See how automated optimization compares to manual review on the platform overview.
- Review the Managed FinOps service if you want expert execution alongside the software.
- MSPs can check the Founding Partner Membership on the EverythingCloud website for current pricing and details.
Get a cloud waste valuation to see where your current process is leaving savings on the table: check your cloud waste valuation.
Authoritative docs and references
- Enabling Cost Explorer
- Filtering and grouping in Cost Explorer
- Accessing reservation recommendations
- GetCostForecast API reference
- For a managed alternative, visit EverythingCloud.
FAQ
What does AWS Cost Explorer do?
AWS Cost Explorer visualizes your AWS spend through interactive charts, generates forecasts, and produces reservation and Savings Plans recommendations. It also supports detailed filtering by tag and dimension, so teams can isolate exactly which service, account, or project is driving cost.
How do I track costs in AWS?
Enable Cost Explorer from the Billing and Cost Management console, then use the default reports (daily costs, by service, by linked account) for routine monitoring. For automated alerts, Cost Anomaly Detection runs in the background once Cost Explorer is active, flagging unusual spend without manual review.
What is the difference between AWS Pricing Calculator and Cost Explorer?
AWS Pricing Calculator estimates the cost of resources you have not yet deployed, useful for planning new workloads. Cost Explorer analyzes actual historical and current spend, plus forecasts future spend based on real usage patterns, which makes the two tools complementary rather than interchangeable.
How much does AWS Cost Explorer cost?
AWS does not publish a per-use fee for standard Cost Explorer reports and forecasts in its core documentation referenced here; check your AWS Billing console for current account-specific details. Teams that want managed optimization layered on top can review EverythingCloud’s Managed FinOps service for pricing on request.