
The strongest approach to commitment management on AWS is a continuous FinOps program, not a one-time purchase decision. That means laddering Reserved Instances and Savings Plans in smaller increments, centralizing purchases at the payer account level, and layering automation or managed oversight on top so coverage keeps climbing without inviting overcommitment risk.
TL;DR:
- Continuous laddering and automation are essential to optimize commitment coverage, prevent overcommitment, and adapt to changing workload demands.
- Monitoring coverage, utilization, and effective savings regularly enables precise adjustments and prevents erosion of expected discounts.
- Centralizing commitments in the payer account and aligning purchase strategies with workload stability improve negotiation leverage and visibility.
- Managing expiring commitments proactively ensures accurate forecasting and avoids unexpected bill spikes due to automatic reversion to on-demand pricing.
- Automated tools like Everythingcloud facilitate daily oversight and incremental purchases, reducing manual effort and maximizing savings.
Table of Contents
- What Is Commitment Management on AWS? Reserved Instances vs. Savings Plans vs. Spot
- The KPIs That Actually Tell You If Your Commitments Are Working
- Buying Tactics: Laddering, Payer Accounts, and Term Length
- Governance: Who Gets the Discount and Who Pays for It
- Native AWS Tools vs. Managed Automation: What Each Actually Delivers
- How Commitments Reshape Your AWS Invoice
- Connecting Commitment Data to Your Broader Cloud Cost Dashboards
- When to Revisit Your Commitments: Reviews, Triggers, and Adjustment Rules
- Why Commitment Expirations Deserve a Spot on Your Budget Calendar
- What Effective Commitment Programs Look Like in Practice
- A Practitioner’s Runbook for Continuous Commitment Management
- How Everythingcloud Handles Commitment Management for You
- Sources
What Is Commitment Management on AWS? Reserved Instances vs. Savings Plans vs. Spot
Commitment management is the discipline of deciding how much AWS compute usage to lock in for a discount, and which instrument to use. Two main tools dominate: Reserved Instances (RIs), which are tied to a specific instance family, region, and sometimes availability zone, and Savings Plans, which are dollar-based commitments that flex across instance types and services. AWS documents both as delivering discounts up to roughly 72% compared to on-demand pricing, depending on term length and payment option.
Spot Instances sit outside this commitment conversation entirely. They offer even steeper discounts but carry interruption risk, so they belong on fault-tolerant, stateless workloads, not the steady-state services you’d commit to for a year or three.
The mechanics differ in ways that matter for financial planning:
- Reserved Instances apply automatically to matching usage but lose value if you retire or resize the instance family they cover.
- Savings Plans apply across a broader footprint (EC2, Fargate, Lambda, in the case of Compute Savings Plans), making them more forgiving when architectures shift.
- Term length drives the discount curve: a 3-year, all-upfront commitment nets a deeper rate than a 1-year, no-upfront one, but it also extends your break-even timeline and locks in assumptions about usage that may not hold.
Getting the instrument choice wrong doesn’t blow up your bill overnight. It just quietly erodes the savings you thought you’d locked in.
The KPIs That Actually Tell You If Your Commitments Are Working
Most finance teams look at the invoice total and call it a day. That’s the wrong altitude. You need three numbers, tracked consistently, to know whether your commitment strategy is doing its job.
- Coverage percentage measures how much of your eligible usage is covered by a commitment versus paid at on-demand rates. Pull this from AWS Cost Explorer’s RI/Savings Plans coverage reports or from a Cost and Usage Report (CUR) export segmented by usage type.
- Utilization percentage measures how much of the commitment you purchased is actually being consumed. A Savings Plan sitting at 60% utilization means you’re paying for capacity you’re not using, which is worse than no commitment at all.
- Effective Savings Rate (ESR) is the metric FinOps practitioners treat as the primary performance indicator for a commitment program, because it measures your blended discount across the entire covered fleet, not just one purchase.
AWS Budgets, layered on top of Cost Explorer and CUR, lets you set alerts when coverage or utilization drifts outside target bands. Treat these three numbers as a monthly scorecard, not a quarterly afterthought.
Buying Tactics: Laddering, Payer Accounts, and Term Length
Buying commitments in one large lump sum is how organizations end up overcommitted six months later when a workload gets decommissioned. The fix is laddering: purchasing smaller commitments on a rolling monthly or quarterly cadence so you’re never betting the whole budget on one forecast. Practitioners who use this approach commonly combine laddering with automation to approach 3-year discount rates while retaining flexibility that a single upfront purchase would never allow.
Where you buy matters as much as when. Centralizing purchases in the payer account gives you the clearest view of aggregate usage and the strongest negotiating position for discount tiers, especially in an AWS Organization with many linked accounts. Letting business units buy locally can work for genuinely autonomous divisions, but it fragments visibility and often duplicates coverage for the same workload type.
A few tactical rules FinOps teams rely on:
- Match term length to workload stability. Steady-state backend services fit a 3-year term; anything still in architectural flux belongs on 1-year or Savings Plans with more flexibility.
- Model break-even in months, not just percentage discount, so finance can compare cashflow impact across purchase options.
- Start conservative on term length until 60 to 90 days of usage data confirms the workload isn’t going away.
- Reassess ladder rungs quarterly against actual growth, not the original forecast.
That margin lets the system mix term lengths and scale down coverage if usage drops, instead of locking you into a rigid ladder you can’t unwind.* Automation paired with explicit flexibility settings is what keeps a laddering strategy from becoming its own liability.
Governance: Who Gets the Discount and Who Pays for It
Savings only count if the organization can trace them back to a real owner. That’s what governance solves.
AWS’s RISP Group Sharing feature lets you define Prioritized or Restricted sharing modes across defined cost groups. Prioritized sharing routes commitment benefits to a specific group first before spilling over to the rest of the organization, useful when one business unit funded the purchase and expects first claim on the ROI. Restricted sharing walls off benefits entirely, appropriate when compliance or contractual separation requires it, even at the cost of some aggregate savings.
Cost categories and tagging are the other half of the governance equation. AWS recommends using Billing Conductor, Cost Categories, and Cost Allocation Tags to build allocable cost data that maps to how the business actually organizes itself, not just how AWS accounts happen to be structured.
Practical governance steps:
- Design cost categories around business units or product lines, not AWS account boundaries, so chargeback reports mean something to a VP reading them.
- Set a chargeback or showback cadence (monthly is standard) so purchasers see the ROI of their own commitments, not a diluted org-wide average.
- Document sharing mode decisions so a new FinOps hire understands why one division’s commitments are restricted while another’s are pooled.
As commitment programs scale, centralized sharing maximizes aggregate savings but can obscure which business unit actually earned the discount. Align your sharing mode to your internal cost allocation model, not the other way around.
Native AWS Tools vs. Managed Automation: What Each Actually Delivers
AWS gives you real tools for free: Cost Explorer’s coverage and utilization reports, its Recommendations engine for RI and Savings Plans sizing, and CUR exports for anyone who wants to build custom dashboards. These are enough to run a basic program manually, especially at smaller scale.
The gap shows up in maintenance. Manual review cycles tend to happen monthly or quarterly, which is too slow to catch a workload change that just knocked your utilization from 90% to 60%. Automated and managed platforms close that gap by monitoring daily and executing incremental purchases without waiting for the next review meeting.
If you go the automation route, permissions matter more than most teams expect:
- Programmatic purchase and modification of RIs and Savings Plans requires specific IAM actions scoped narrowly to commitment management, never broad billing admin access.
- Automated tools should expose a flexibility percentage setting so purchases don’t outrun actual usage growth.
- Dashboards that forecast the spend needed to hit a target coverage level, similar to the visualization and forecasting features some cloud management platforms provide, turn a monthly spreadsheet exercise into a daily glance.
The gains from automation aren’t hypothetical. Continuous laddering with built-in safety controls tends to push coverage higher and hold utilization steadier than quarterly manual purchase cycles, simply because the system reacts to usage changes within days instead of months.
How Commitments Reshape Your AWS Invoice
An AWS invoice with heavy commitment coverage looks nothing like a pure on-demand bill, and that trips up finance teams reading it for the first time. Line items that once tracked linearly with usage now show a blended rate: covered usage appears at the discounted commitment rate, while any usage beyond your commitment falls back to on-demand pricing on the same line.
This is where coverage and utilization become invoice-reading tools, not just KPIs. If a service’s effective rate looks higher than expected, the first question is whether coverage dropped, meaning more usage spilled into on-demand territory, or whether a new instance family isn’t matched to an existing RI. Savings Plans complicate this further because their dollar-based application spreads across multiple services, so a single Savings Plan purchase might show its discount effect on EC2, Fargate, and Lambda line items simultaneously.
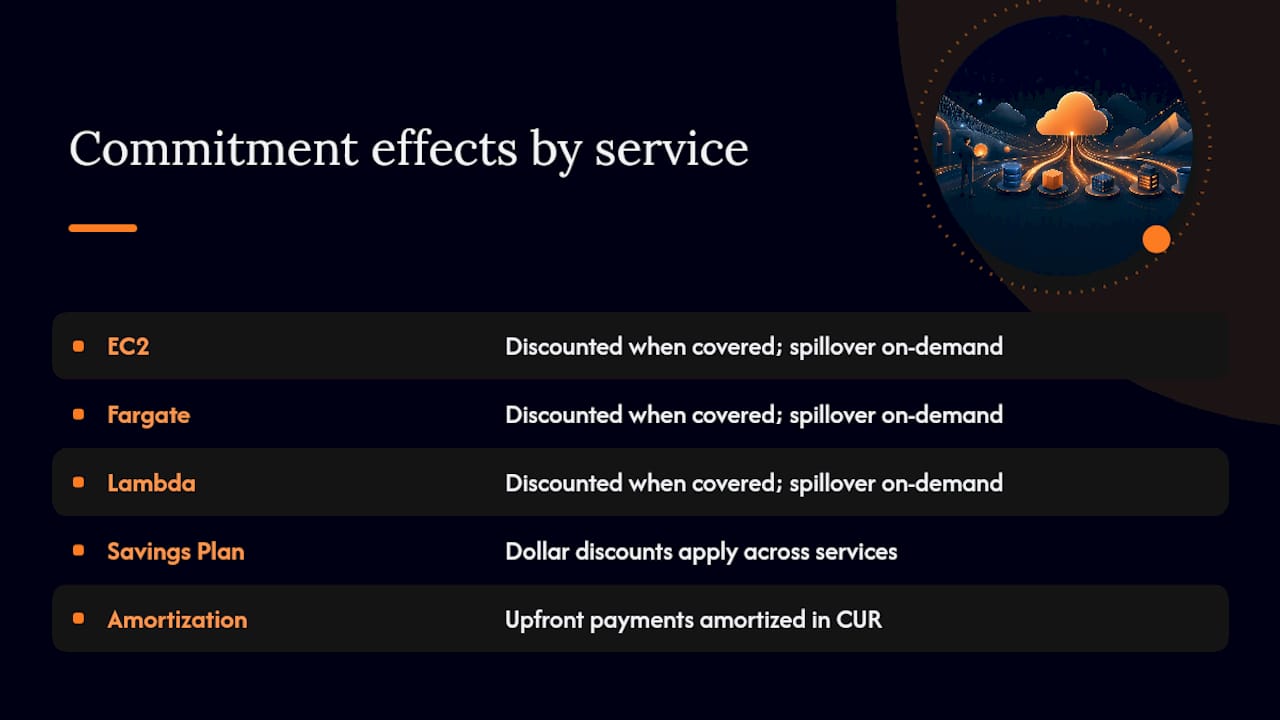
Amortization adds another layer. Upfront and partial-upfront payments get spread across the commitment term in the CUR, so the invoice you see in month three of a 3-year term reflects an amortized slice of a payment made much earlier. Finance teams reconciling actual cash outflow against the accounting expense need to separate these two views, or budget variance reports will show phantom discrepancies that aren’t really discrepancies at all.
The practical takeaway: never read an AWS invoice line by line without cross-referencing the coverage and utilization reports for that billing period. A rate that looks wrong is almost always a coverage or amortization artifact, not a billing error. Build that cross-reference into your monthly close process rather than treating it as an escalation only when someone in finance notices a spike.
Connecting Commitment Data to Your Broader Cloud Cost Dashboards
Commitment coverage and utilization can’t live in a silo separate from your overall cloud cost management view. The moment they do, finance ends up reconciling two different stories about the same spend, one from the AWS billing console and another from whatever dashboard leadership actually looks at.
The practical fix is feeding CUR data, along with Cost Explorer’s RI and Savings Plans reports, into whatever centralized cost management or FinOps dashboard your organization already uses for multi-cloud or SaaS spend visibility. That gives you one place to see coverage percentage sitting alongside total spend, anomaly alerts, and budget variance, instead of toggling between the AWS console and a separate finance spreadsheet.
A few integration points matter more than others:
- Cost categories, once built for chargeback, should flow directly into dashboard filters so business unit owners see their own coverage and utilization, not an org-wide blend.
- Anomaly detection tools work better when they’re aware of commitment coverage, since a spend spike in covered usage means something very different than a spike in uncovered, on-demand usage.
- Renewal dates and expiration schedules belong on the same dashboard as spend trends, so forecasting doesn’t happen in a separate tool from monitoring.
Organizations running AWS alongside Azure, Google Cloud, or a heavy SaaS footprint tend to feel this pain first, because the temptation to manage AWS commitments in isolation is strongest when it’s the only cloud with a native commitment marketplace. A consolidated dashboard, whether built in-house or through a platform like Everythingcloud’s insights resources, keeps commitment data from becoming an island that only the cloud team understands.
When to Revisit Your Commitments: Reviews, Triggers, and Adjustment Rules
A commitment strategy set once and left alone for a year is a strategy quietly decaying. Usage patterns shift faster than most purchase cycles account for, and the gap between what you committed to and what you’re running shows up first in utilization, not in the invoice total.
Set a review cadence and stick to it. Monthly reviews of coverage and utilization catch drift early; quarterly reviews are the minimum for reassessing whether your ladder rungs still match business reality. Between formal reviews, a few triggers should force an immediate look regardless of schedule:
- A planned architecture migration, container adoption, or a shift to serverless that changes which instrument (RI versus Savings Plan) makes sense.
- A merger, acquisition, or major account restructuring that changes your AWS Organization’s usage baseline overnight.
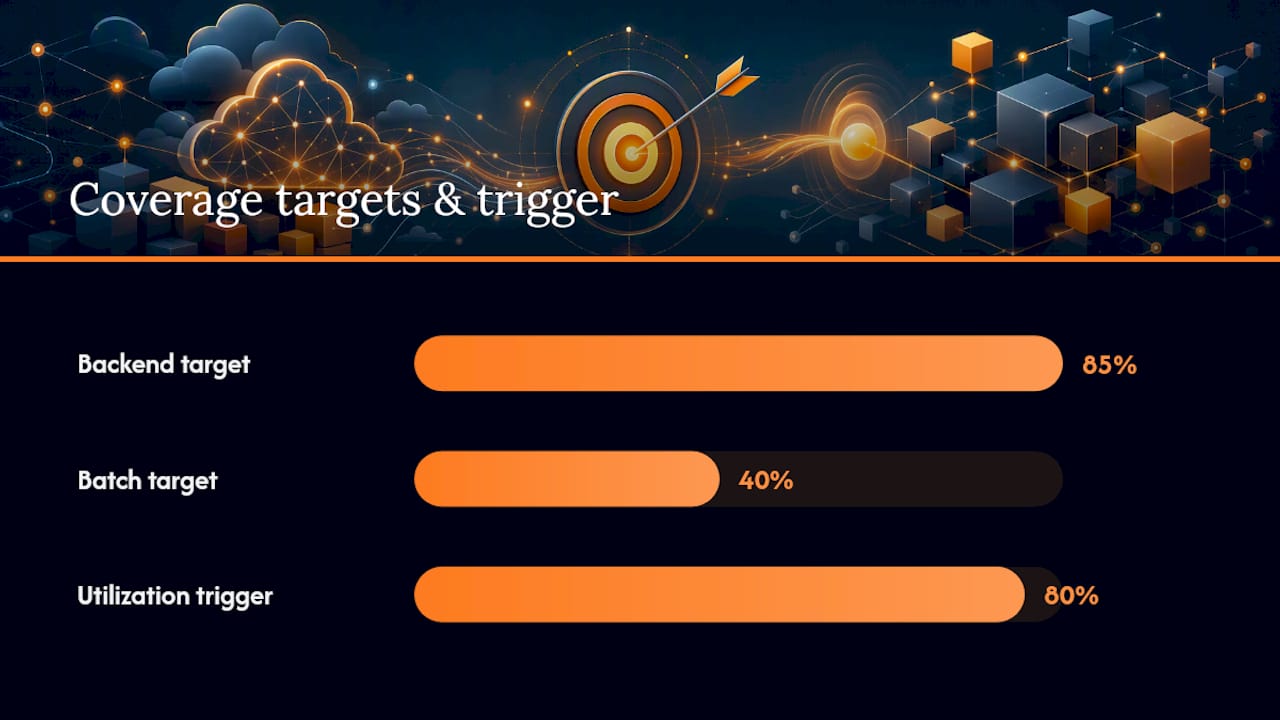
- Utilization dropping below a set threshold, commonly 80%, for two consecutive billing cycles.
- A new workload category (batch processing, ML training) entering the environment that doesn’t fit your existing coverage targets.
Enterprise teams increasingly set coverage targets by workload category rather than one blanket organizational target, enforcing them through cost categories and automated alerts. A steady-state backend service might carry an 85% coverage target while a bursty batch workload sits closer to 40%, with the difference made up by Spot or on-demand capacity.
The organizations that avoid stranded commitments treat review as a standing calendar item, not a response to a bad invoice.
Why Commitment Expirations Deserve a Spot on Your Budget Calendar
An expiring 3-year Savings Plan doesn’t just end quietly. It reverts that usage to on-demand pricing the day after expiration unless someone has already planned the renewal, and that reversion can spike a monthly bill by a meaningful percentage if the covered usage was large.
The forecasting problem is subtler than it sounds. Finance teams building next year’s cloud budget often extrapolate from the current month’s blended rate, forgetting that the blended rate includes commitment discounts set to expire mid-year. Get the expiration calendar wrong and the budget looks accurate in January and wildly understated by August.
The fix is maintaining an inventory of every commitment, its term, and its expiration date, reviewed alongside forecasted usage before the renewal window opens, not after the commitment has already lapsed. Build renewal decisions 60 to 90 days ahead of expiration, giving enough time to evaluate whether the workload that justified the original purchase still exists, has grown, or has shrunk.
Renewal isn’t a rubber stamp. A workload might justify a longer term now that it’s proven stable, or it might warrant switching from a Reserved Instance to a Savings Plan if the architecture has become more flexible since the original purchase. Treat every expiration as a fresh purchase decision informed by two or three years of actual usage data, not a renewal of the original assumption.
What Effective Commitment Programs Look Like in Practice
The pattern across well-run commitment programs is consistent: they treat purchasing as an ongoing process, not an annual event, and they measure it with the same rigor finance applies to any other capital decision.
A typical trajectory looks like this. Coverage climbs steadily instead of jumping and stranding capacity, and utilization stabilizes in the 85 to 90% range because each new rung reflects actual, recent usage rather than a stale forecast.
Another common pattern involves multi-account organizations that started with business units purchasing commitments independently, duplicating coverage for the same workload type across two divisions. Centralizing purchases at the payer level, combined with RISP Group Sharing configured in Prioritized mode, resolved the duplication while still letting each division see its own contribution through cost categories.
The throughline in both cases is that manual, calendar-driven purchasing eventually hits a ceiling. Coverage stalls, utilization drifts, and someone in finance starts asking why the blended discount rate looks worse than last quarter. That’s usually the point where organizations shift toward automated, continuously monitored purchasing, because the alternative is a FinOps analyst manually re-running the same coverage report every week and hoping to catch drift before it costs real money.
A Practitioner’s Runbook for Continuous Commitment Management
Here’s how the discipline actually plays out month to month: inventory every existing commitment, set coverage targets by workload category, purchase in laddered increments against those targets, monitor coverage and utilization daily, then adjust through automation or manual override as usage shifts. That cadence, repeated without gaps, is what separates programs that compound savings from ones that leak them.
Continuous monitoring paired with automated incremental purchases catches utilization drift within days instead of a quarterly review cycle. Maintaining an inventory and running regular operational reviews is the difference between a program that compounds savings and one that quietly accrues stranded commitments nobody notices until the annual audit.
— Dan
How Everythingcloud Handles Commitment Management for You
Running this cadence by hand, inventory, laddering, daily monitoring, adjustment, month after month, is exactly the kind of work that erodes margin when it’s left to manual spreadsheets and quarterly check-ins. Everythingcloud’s platform builds that continuous FinOps discipline directly into the tooling, so coverage and utilization stay visible and commitments get adjusted automatically instead of drifting for months between reviews.
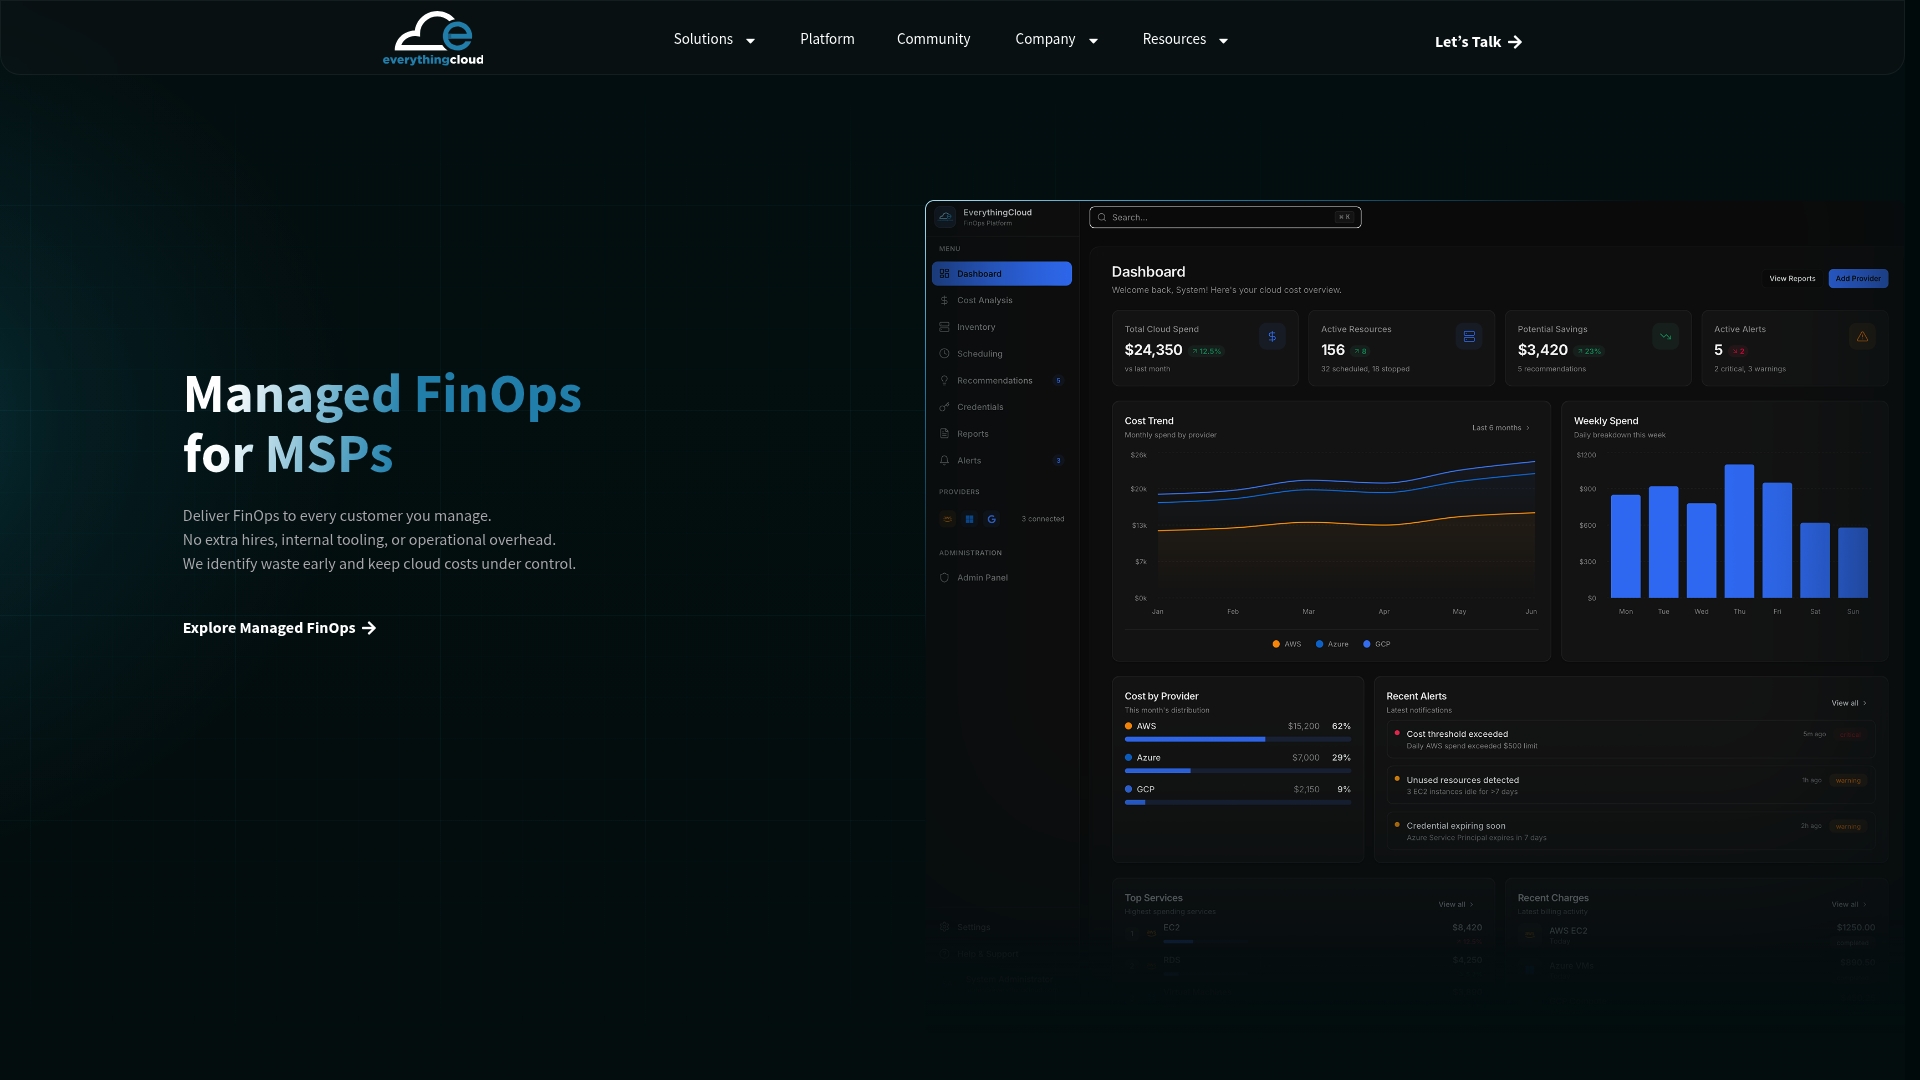
The platform gives financial and cloud operations teams real-time visibility into coverage, utilization, and Effective Savings Rate, alongside automated recommendations and purchase execution governed by the flexibility controls covered above. For MSPs and technology partners, Everythingcloud’s managed FinOps offering packages this same continuous optimization into a turnkey service you can extend to clients without building the automation in-house. Organizations typically see coverage climb and manual purchase review time drop once monitoring shifts from quarterly to daily.
If your commitment program is still running on a spreadsheet and an annual purchase meeting, explore Everythingcloud’s platform or get in touch to evaluate a fit for your AWS environment this quarter.
Sources
- AWS Cloud Financial Management services and tools
- Strategic AWS Cloud Commitment Management in the FinOps framework
- A Primer on Commitment Discount Management (AWS)