
Cloud unit economics measures the infrastructure cost to deliver one discrete unit of business value, whether that is a customer, a transaction, or an API call. Rather than watching aggregate monthly cloud spend, you track cost-per-X, which tells you whether a rising bill reflects healthy growth or quiet margin erosion. Three things follow from that shift: Finance and Engineering finally share a common metric; you can judge whether new spend is justified by new value; and you can target optimizations precisely instead of cutting blindly.
The FinOps Foundation defines cloud unit economics as a formal capability within the FinOps Framework, and both Azure Cost Management and Everythingcloud treat it as a prerequisite for any mature cost governance program.
Your single action for today: pull last month’s billing export and usage data, pick one unit (cost per active customer is the most common starting point), and compute a rough baseline. A directional number this week is worth more than a precise model next quarter.
- Cloud unit economics aligns Finance and Engineering on margin, not just spend.
- A falling cost-per-unit while overall spend rises is the signal of efficient scaling, not overspending.
- Targeted optimization, pricing decisions, and commitment purchases all depend on a trusted unit baseline.
Key Takeaways
Cloud unit economics works when it is treated as a continuous governance program, not a one-time analysis: pick a unit, instrument telemetry, allocate shared costs with documented assumptions, and track unit margin as a standing KPI.
| Point | Details |
|---|---|
| Start with one unit | Pick cost per active customer or cost per API call and compute a baseline from last month’s billing data before expanding. |
| Telemetry before automation | Instrument reliable unit counting in your application before building automated allocation pipelines. |
| Document allocation assumptions | Use proportional utilization or activity-based costing for shared costs, and version every rule change for auditability. |
| Track unit margin as a core KPI | Monitor cost per unit, unit margin, and QoQ trend alongside the percentage of cloud spend tied to revenue-bearing units. |
| Everythingcloud accelerates the program | The platform automates billing ingestion, allocation, and anomaly detection; managed FinOps adds expert oversight for baseline-to-automation delivery. |
Table of Contents
- What is cloud unit economics, and why does it matter?
- How do you choose the right unit metric?
- What data do you need to map cloud costs to units?
- How do you allocate shared infrastructure costs to units?
- How do you implement a cloud unit economics program?
- What KPIs and governance structures should you build around unit costs?
- Which tools help you implement cloud unit economics?
- What are the common pitfalls in measuring cloud unit economics?
- Worked example: calculating cost per customer
- A practical perspective on where unit economics programs actually succeed
- Everythingcloud turns unit economics from a one-time exercise into continuous governance
- Sources
What is cloud unit economics, and why does it matter?
Cloud unit economics is the practice of mapping cloud infrastructure costs to discrete business units so you can measure margin efficiency rather than relying on aggregate spend. The concept sits at the intersection of activity-based costing (ABC) and the FinOps Framework’s “Quantify” capability. Where traditional FinOps reporting tells you how much you spent, unit economics tells you what you got for it.
Common units include:
- Cost per active customer — the most widely used starting point for SaaS and subscription businesses
- Cost per transaction — natural for payment platforms, e-commerce, and marketplace models
- Cost per API call — fits developer platforms, data APIs, and microservices
- Cost per active workspace — useful for collaboration tools and multi-tenant SaaS
- Cost per feature run — relevant for serverless or event-driven architectures
- Cost per model inference — increasingly important as AI workloads grow
The right unit depends on your business model. A multi-tenant SaaS product serving thousands of small customers usually starts with cost-per-customer. A marketplace with highly variable transaction sizes often finds cost-per-transaction more revealing. Internal tooling teams frequently use cost-per-request because it maps directly to engineering decisions.
Datadog’s guide to cloud unit economics frames it well: unit economics connects cloud spending to specific outcomes, so teams can decide whether rising costs are justified by growing value. That framing also explains why unit economics complements FinOps governance. Monthly spend reviews tell you the total; unit metrics tell you the story behind it.
SaaS finance teams will recognize the parallel to the five core SaaS metrics: CAC, LTV, LTV:CAC ratio, CAC payback period, and gross margin. As Rework’s SaaS metrics guide explains, these frames map directly to cloud unit economics when you replace “cost to serve” with cloud-attributable cost of goods sold. That connection is what makes unit economics credible to CFOs, not just FinOps practitioners.
How do you choose the right unit metric?
Picking the wrong unit is the most common early mistake. A unit that feels technically clean but doesn’t map to how your business generates revenue will produce numbers nobody acts on.
Run each candidate unit through this checklist before committing:
- Business alignment: Does this unit correspond to a revenue line, a pricing tier, or a customer commitment?
- Measurability: Do you have telemetry today to count this unit reliably?
- Ownerability: Is there a team or product owner who can respond when the unit cost moves?
- Stability: Does the unit count fluctuate so wildly that short-term noise drowns the signal?
- Actionability: Can an engineer or architect actually change the cost drivers behind this unit?
- GTM alignment: Does this unit match how you price and sell?
| Unit | Best fit | Watch out for |
|---|---|---|
| Cost per active customer | SaaS, subscription, seat-based | Inactive customers inflate denominator |
| Cost per transaction | Payments, marketplace, e-commerce | High variance in transaction size skews averages |
| Cost per API call | Developer platforms, data APIs | Very high volume makes per-call cost tiny; use per-1,000 calls |
| Cost per seat | Collaboration, productivity tools | Seats don’t reflect actual usage intensity |
| Cost per workspace | Multi-tenant SaaS | Workspace size varies; segment by tier |
| Cost per inference | AI/ML platforms | Model size and context length drive huge cost variance |
One frequently overlooked issue: mixing GTM motions. If you serve both product-led growth (PLG) customers on a free tier and enterprise accounts on negotiated contracts, blending them into one unit metric produces a number that is misleading for both segments. Calculate separate unit economics for each motion. The PLG unit cost tells you about self-serve efficiency; the enterprise unit cost informs professional services and onboarding investment.
Pro Tip: Start with one high-impact unit and get a working baseline before adding more. Two units with clean telemetry beat six units with patchy data.
Revolgy’s FinOps unit economics guide recommends cost per active customer as the default first metric because it is intuitive, maps to revenue, and forces the right conversation between Finance and Engineering almost immediately.
What data do you need to map cloud costs to units?
Getting the data right is where most programs stall. You need at least four categories of inputs before you can build a reliable cost-per-unit model.
Required data sources:
- Provider billing exports — AWS Cost and Usage Reports (CUR), Azure Cost Management exports, or Google Cloud Billing exports. These give you the raw spend by service, SKU, and tag.
- Resource tags and labels — tags are the primary mechanism for attributing costs to products, teams, or customers. Without consistent tagging, you are allocating by assumption.
- Application telemetry — traces, logs, and metrics that count your unit (requests, active customers, transactions). Tools like Datadog provide both observability and cost management features in one platform.
- Service-specific usage APIs — most cloud providers expose usage data through APIs (Azure Monitor, AWS CloudWatch) that give finer granularity than billing exports alone.
- Pricing catalog and commitment data — Azure pricing models include pay-as-you-go, reservations, and hybrid benefits. Each changes the effective cost per resource, so your model needs to reflect actual billed rates, not list prices.
- Business metrics — active customer counts, transaction volumes, or API call counts from your product database or analytics layer.
Microsoft Learn’s unit economics guidance specifically recommends Azure Monitor metrics and service-specific APIs as telemetry sources, and advises automating the calculation wherever possible. Manual joins between billing exports and usage data work for a pilot, but they don’t scale.
Integration steps to make the mapping repeatable:
- Centralize billing exports into a data warehouse (BigQuery, Synapse, Redshift, or similar).
- Normalize timestamps so billing periods align with your business metric periods.
- Standardize unit labels across billing tags and telemetry dimensions.
- Build a join layer or ETL pipeline that produces a cost-per-unit dataset on a scheduled refresh.
- Version the mapping logic so allocation rule changes are auditable.
A word on data gaps. Missing tags are the norm, not the exception, especially in environments that have grown organically. When direct attribution is impossible, use proxies: an API gateway’s request count can stand in for application-level telemetry; sampling a representative week can estimate monthly patterns. Document every proxy clearly. A directional number with known assumptions is more useful than a precise number built on hidden guesses.
Wiz’s breakdown of cloud cost drivers is worth reviewing here: compute typically dominates the bill, but observability and data egress are frequently overlooked cost centers that can materially distort a unit-cost model if excluded.
How do you allocate shared infrastructure costs to units?
Shared infrastructure is where unit economics gets genuinely hard. A database cluster, a load balancer, a logging pipeline, or a shared Kubernetes node pool serves multiple products or customers simultaneously. You cannot directly attribute its cost to a single unit, so you need an allocation method.

Direct attribution works when telemetry is granular enough to tie a resource to a specific unit. A dedicated RDS instance for a single customer tier is a clean example. Use this wherever you can.
Proportional utilization splits shared costs by measured consumption. CPU, I/O, and request counts are common split keys. This is the most defensible method when telemetry exists.
Activity-based costing (ABC) assigns costs based on the activities that drive them. A shared Kubernetes cluster might allocate costs by pod CPU and memory requests rather than actual consumption, which smooths out burst effects. ABC requires more setup but produces stable, predictable allocations.
Fixed overhead allocation treats some shared costs as a flat overhead rate spread across all units equally. Useful for costs that are genuinely fixed regardless of usage, such as a monitoring platform license or a baseline network transit fee. The risk is that it obscures which units are actually driving those costs.
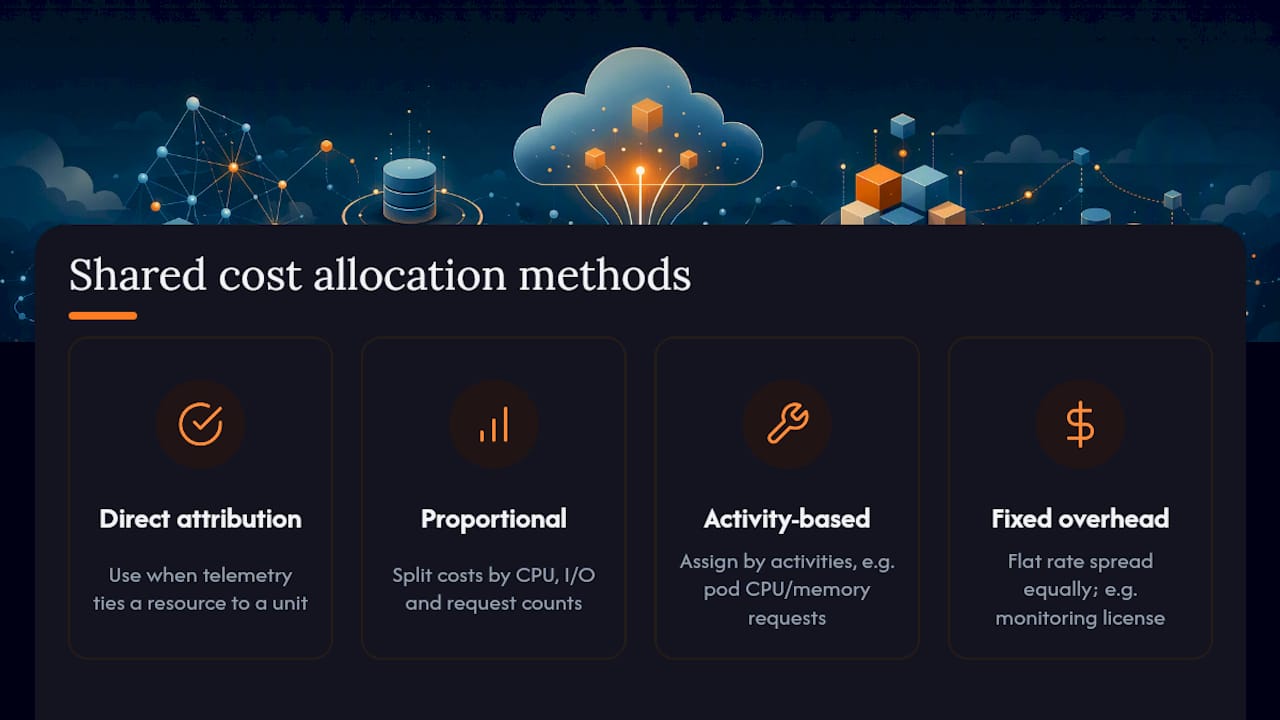
Hybrid approaches combine methods. A common pattern: directly attribute compute and storage, use proportional utilization for shared databases, and treat observability as fixed overhead. Document which method applies to which service category.
A short example: your observability platform costs $8,000 per month and serves three products. A proportional allocation assigns $4,000, $2,400, and $1,600 respectively. If you instead spread it equally at $2,667 each, Product A’s unit cost is understated and Product C’s is overstated.
For multi-tenant environments, the safest default is proportional utilization, with a documented fallback to equal split when usage data is unavailable. Never silently absorb shared costs into a single product’s unit metric without flagging the assumption.
How do you implement a cloud unit economics program?
Implementation has a predictable shape: a quick baseline, a structured pilot, and then automation. Teams that try to build the full model before seeing any numbers almost always stall.
- Pick your unit. One unit, one product, one team to start.
- Inventory services and owners. List every cloud service that contributes to delivering that unit and identify the team responsible for each.
- Enable telemetry. Confirm you can count the unit reliably. If not, instrument it before proceeding.
- Ingest billing and usage data. Pull billing exports and align them to your business metric period.
- Build the mapping model. Join billing data to usage data using tags, resource IDs, or proxy metrics.
- Validate with owners. Share the first numbers with Engineering and Finance. Sanity-check against engineering estimates and known anomalies.
- Run a pilot. One product or customer segment, four to eight weeks. Identify the top three cost drivers.
- Automate and schedule refreshes. Move from manual spreadsheets to a scheduled pipeline.
- Roll out and set KPIs. Expand to additional units and establish reporting cadence.
Roles that need to be in the room:
- FinOps owner — drives the program, owns the allocation model and KPI definitions
- Product owner — defines the unit and validates that it maps to business behavior
- DevOps/Platform engineer — instruments telemetry and owns tagging standards
- Data engineer — builds and maintains the ETL pipeline
- Finance analyst — connects unit cost to gross margin and financial reporting
- Executive sponsor — removes blockers and ensures cross-team accountability
On timeline: a rough baseline is achievable in under four weeks if billing exports and basic telemetry are already in place. A validated pilot typically takes one to three months. Full automation and multi-unit coverage usually lands in the three-to-six-month range.
The FinOps Foundation’s unit economics capability is explicit that without automated mapping of application requests to infrastructure costs, programs remain stuck at aggregate spend views. Manual efforts work for a pilot; they don’t scale beyond it.
What KPIs and governance structures should you build around unit costs?
A unit economics program without governance is just a spreadsheet exercise. The numbers need to live inside a reporting cadence that Finance trusts and Engineering acts on.
Core KPIs to track:
- Cost per unit — the primary metric, tracked as both a point-in-time value and a trend
- Unit margin — revenue per unit minus cost per unit, expressed as a percentage
- Unit contribution to gross margin — how much each unit type contributes to overall gross margin
- Unit cost trend (QoQ) — quarter-over-quarter change; a rising trend needs explanation
- Percent of cloud spend attributable to revenue-bearing units — the share of your bill you can tie to a paying customer or billable event
- Anomaly rate — the frequency of unit-cost spikes that exceed a defined threshold
Dashboard elements worth building: a top-drivers-by-service view, a usage-vs-cost trend chart, a per-unit time series going back at least six months, and an allocation sensitivity toggle that lets analysts test different overhead assumptions without rebuilding the model.
Reporting cadence:
- Daily: automated anomaly alerts for unit-cost spikes
- Weekly: team-level review of cost drivers and tagging coverage
- Monthly: FinOps signoff on unit cost trends and allocation accuracy
- Quarterly: integration with financial forecasting and pricing review
Governance requires ownership. Every service in the allocation model needs a named owner. Allocation rule changes need to be versioned and reviewed before they go into production, because a silent rule change can make unit costs appear to improve or worsen without any actual operational change.
For teams building enterprise FinOps governance, the ownership model and SLA structure are often the hardest parts to establish, not the technical instrumentation.
Which tools help you implement cloud unit economics?
No single tool covers the full stack. You typically need a combination of billing export infrastructure, telemetry, and a cost allocation or FinOps platform.
Billing export and ETL: AWS CUR and Azure Cost Management exports are the starting point. Both provide service-level spend data with tag dimensions. Azure Cost Management also offers budget alerts and cost analysis views that are useful for early-stage programs.
Observability and telemetry: Datadog is the most widely used platform for combining application telemetry with cloud cost data. Its Cloud Cost Management feature maps infrastructure spend to application services and teams, which shortens the gap between billing data and unit attribution.
Kubernetes cost allocation: For containerized workloads, Kubecost and OpenCost provide namespace- and workload-level cost attribution that standard billing exports cannot. OpenCost is the open-source CNCF project; Kubecost adds enterprise features on top. A detailed comparison is available in Everythingcloud’s Kubecost vs OpenCost guide. For broader Kubernetes cost strategy, the Kubernetes cost optimization guide covers allocation and rightsizing in depth.
FinOps platform and managed services: Everythingcloud combines telemetry ingestion, allocation automation, anomaly detection, and managed FinOps expertise into a single platform covering AWS, Azure, Google Cloud, Microsoft 365, and AI workloads. For MSPs, it provides a turnkey “FinOps in a Box” model that enables managed unit economics as a client service without building the infrastructure from scratch.

Community and framework resources: The FinOps Foundation publishes capability guides, working group outputs, and practical playbooks for unit economics implementation. Microsoft Learn’s FinOps unit economics page provides Azure-specific implementation guidance with telemetry examples.
Choosing between DIY and managed: DIY tooling (billing exports, Datadog, Kubecost) gives you control and flexibility but requires data engineering capacity and ongoing maintenance. A managed FinOps platform accelerates the baseline-to-automation path and adds expert oversight, which matters when internal capacity is limited or when the program needs to scale across multiple products or client accounts quickly.
What are the common pitfalls in measuring cloud unit economics?
The measurement challenges are real, and teams that ignore them tend to either abandon the program or, worse, act on numbers that are quietly wrong.
Missing or inconsistent tagging is the most common blocker. Resources deployed without tags cannot be directly attributed, so they fall into an unallocated pool that distorts every unit metric. Fixing tagging retroactively is painful; enforcing it at provisioning time through policy is far more effective.
Bursty workloads create a marginal-cost vs average-cost problem. If your infrastructure scales up sharply during peak hours, the average cost per unit across the month may look healthy while the marginal cost of the peak period is unsustainable. Segment your analysis by time window when workloads are highly variable.
Multi-tenant complexity means a single infrastructure resource serves customers with very different consumption profiles. A small customer on a shared cluster may appear to cost the same as a large one if you use equal allocation. Proportional utilization solves this, but only if you have the telemetry to measure it.
Treating short-term optimization as the only goal is a strategic mistake. Unit economics is most valuable as a continuous governance mechanism, not a one-time cost-cutting exercise. Teams that run a unit economics project, cut costs, and then stop measuring tend to see costs creep back within two or three quarters.
Mitigation patterns:
- Use proxies (API gateway request counts, synthetic telemetry) where direct instrumentation is missing.
- Run sensitivity analysis on allocation assumptions before publishing numbers.
- Treat the first baseline as directional, not definitive. Communicate that clearly to stakeholders.
- Keep an audit log of every allocation rule change, versioned and timestamped.
- Document all assumptions in a shared location that Finance and Engineering can both access.
The goal is not a perfect model.
Worked example: calculating cost per customer
This example walks through a single-product SaaS scenario with 1,000 active customers in a given month.
Sample inputs:
Step-by-step calculation:
- Sum all directly attributable costs: $18,000 + $1,200 = $19,200.
- Add proportionally allocated shared costs: $2,400 + $280 = $2,680.
- Add fixed overhead allocation: $1,000.
- Subtract committed purchase discounts: ($4,200).
- Total attributable cost = $18,680.
- Divide by active customer count: $18,680 ÷ 1,000 = $18.68 per active customer per month.
- If average revenue per customer is $45/month, unit margin = ($45 − $18.68) / $45 = 58.5%.
Validation checklist before publishing the number:
- Does the total attributable cost reconcile to within 5% of the product’s tagged spend in the billing export?
- Has the Engineering lead reviewed the compute and egress figures?
- Are reserved instance discounts applied at the effective rate, not the list rate?
- Is the active customer count sourced from the product database, not a marketing estimate?
- Have you documented which allocation method applies to each shared cost line?
This same structure adapts directly to cost-per-API-call (replace active customers with total API calls in the denominator) or cost-per-inference (replace with inference count and add model hosting costs as a direct line). The formulas don’t change; the unit definition and denominator do.
Pro Tip: Build this model in a spreadsheet first. Once the logic is validated by Finance and Engineering, migrate it to an automated pipeline. Skipping the spreadsheet phase means you automate assumptions nobody has reviewed.
A practical perspective on where unit economics programs actually succeed
Most unit economics programs fail quietly, not loudly. The team builds a model, runs it once, presents the numbers at a quarterly review, and then the spreadsheet sits untouched for six months. That pattern is not a data problem. It is a governance problem.
The programs that produce lasting results share three characteristics. First, there is a named FinOps owner who treats unit cost as a standing agenda item, not a project deliverable. Second, the numbers are connected to decisions: pricing reviews, commitment purchases, capacity planning, and product roadmap trade-offs. Third, Engineering sees the unit cost data as useful to them, not just a Finance reporting requirement.
The Revolgy FinOps guide describes three operational states a unit cost can signal: improving cost per customer (scale is working), worsening cost per customer (operational fixes needed), or a structural cost problem requiring architecture changes. That three-state framing is worth putting in front of your engineering leadership explicitly. It reframes unit economics from a Finance audit tool into an engineering signal.
Committed purchases deserve a specific mention. Reservations and savings plans can reduce unit costs by 30%–60% compared to on-demand rates, but only when the unit forecast is stable enough to commit with confidence. A unit economics baseline is what gives you that confidence. Teams that skip the baseline and buy commitments based on aggregate spend trends frequently over-commit on workloads that are actually shrinking and under-commit on the ones growing fastest.
For MSPs, the packaging opportunity is real. A unit economics baseline pilot delivered as a four-to-eight-week engagement with clear SLAs and a defined output (a validated cost-per-customer model for one product) is a credible managed service offering. Clients who see their unit cost for the first time almost always want to know more.
Everythingcloud turns unit economics from a one-time exercise into continuous governance
Running a unit economics baseline once is useful. Running it continuously, with automated anomaly detection and managed expert oversight, is where the margin protection actually compounds.
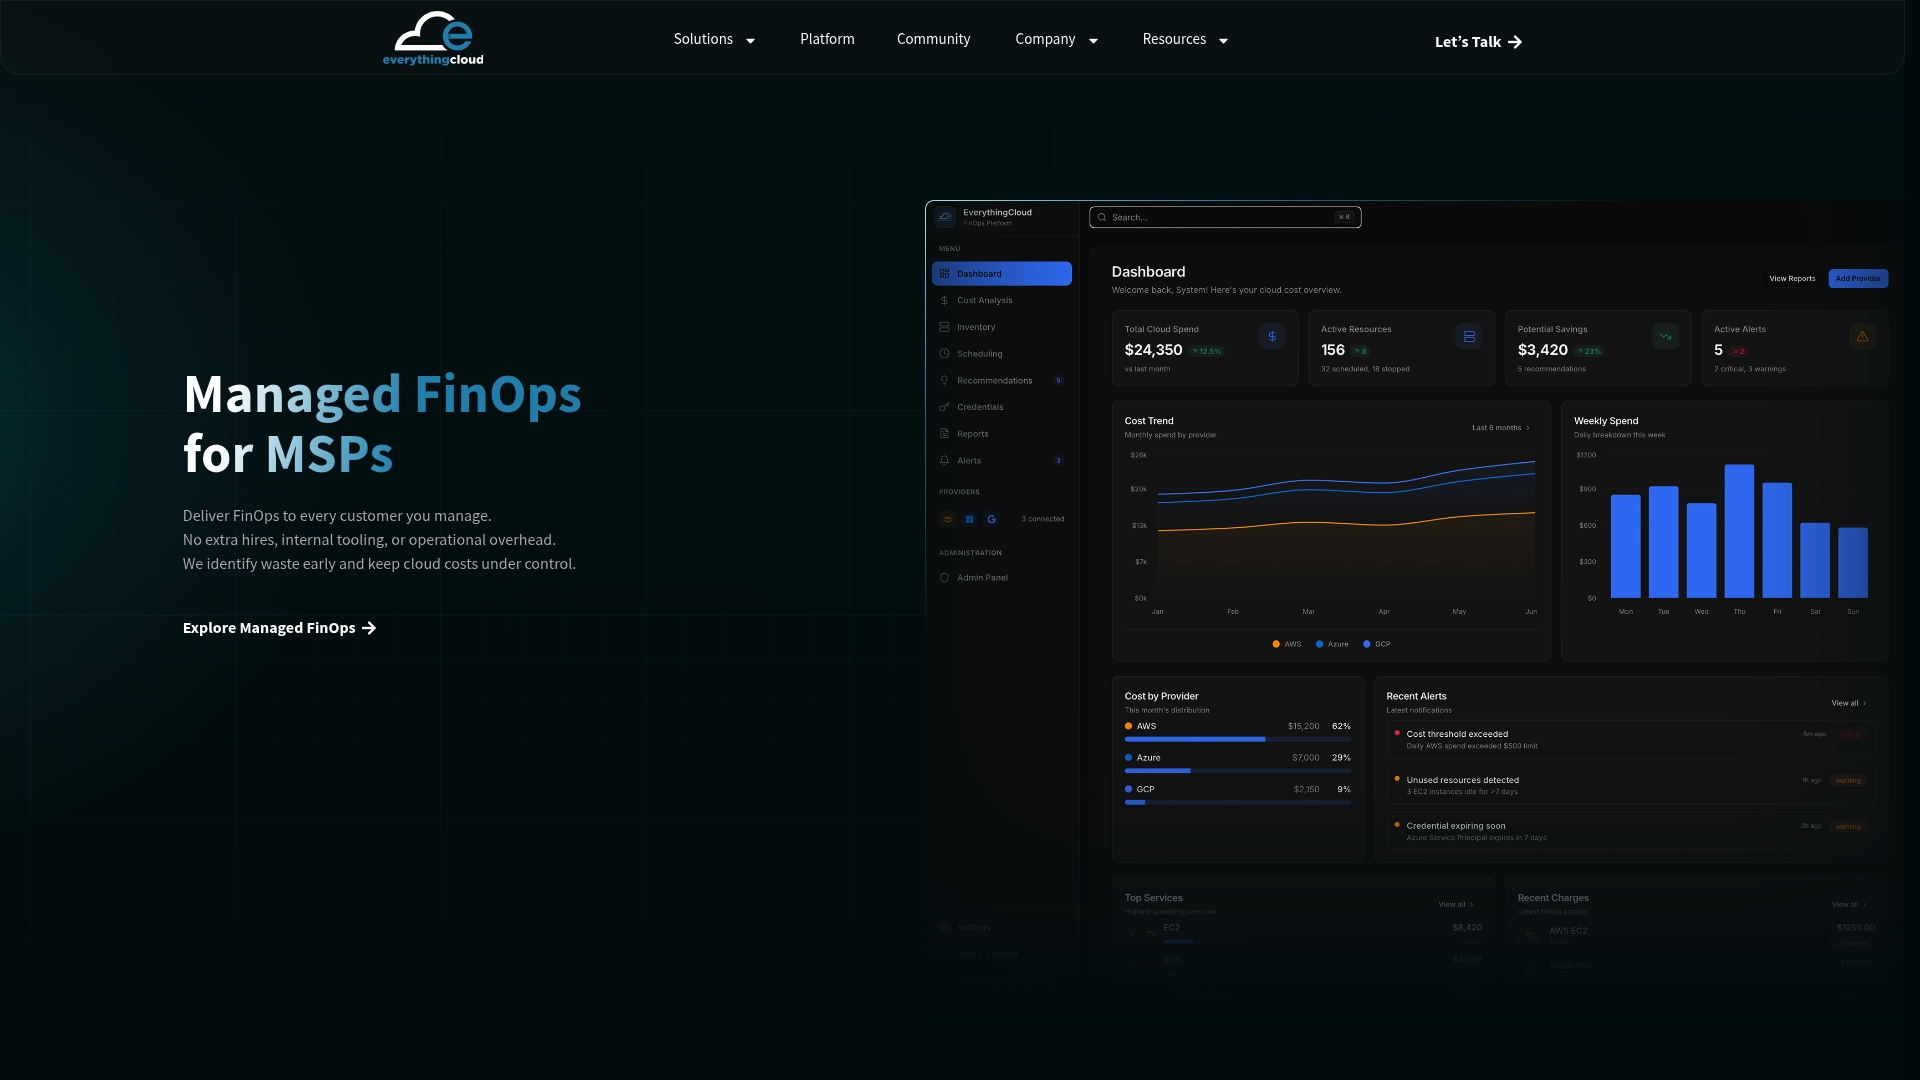
Everythingcloud’s platform combines real-time billing ingestion across AWS, Azure, and Google Cloud with allocation automation, anomaly detection, and executive reporting, so your unit cost model refreshes automatically rather than aging in a spreadsheet. For teams that need expert support, the managed FinOps service provides FinOps practitioners who handle baseline setup, allocation modeling, commitment strategy, and monthly governance reviews. MSPs can deploy the same capability as a white-label service to their client base without building the infrastructure themselves.
The practical outcome: faster time to a validated baseline, continuous savings identification, and a governance layer that Finance and Engineering both trust. If you are ready to move from aggregate spend reporting to per-unit margin visibility, talk to the Everythingcloud team about a pilot engagement.
Sources
These resources provide authoritative implementation guidance and community knowledge for teams building a unit economics program.
- Introduction to Cloud Unit Economics
- Unit economics – Cloud Computing | Microsoft Learn
- A guide to cloud unit economics
- Cloud FinOps unit economics: Is your growing cloud bill a problem or an asset?
- What Is Cloud Cost? | Wiz
- SaaS Metrics & Unit Economics: The 5 Numbers That Matter (2026)